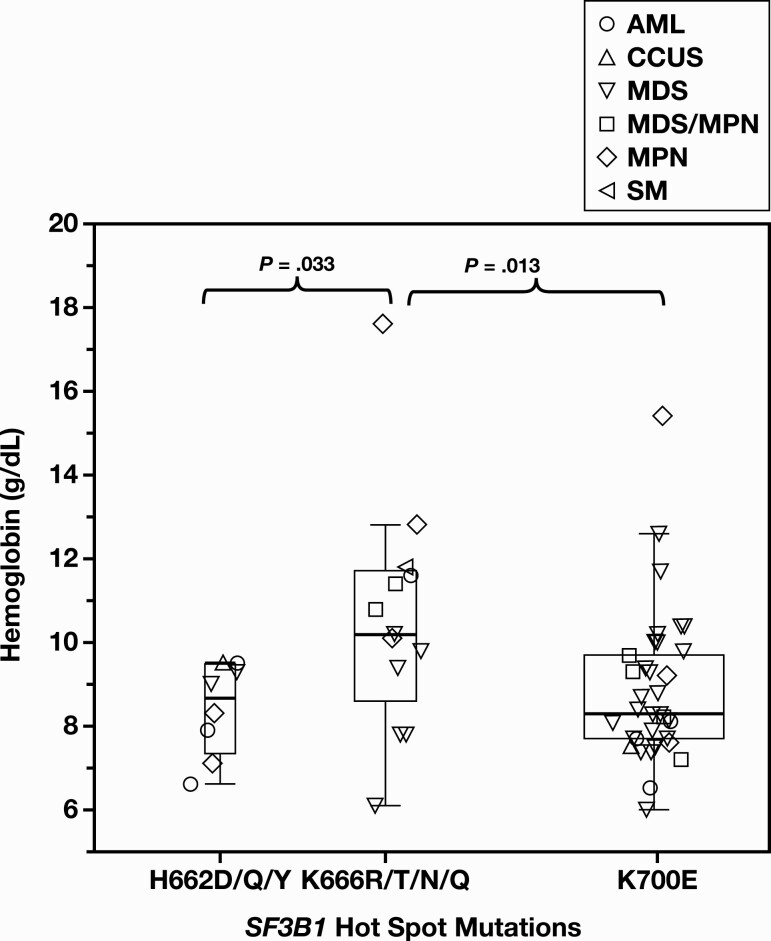
Figure 2.
Association between SF3B1 mutational hotspots and hemoglobin levels. A whisker plot of the hemoglobin levels of 3 SF3B1 mutational hotspots K700, K666, and H662, showing range, interquartile range, and median of the hemoglobin levels. Different label shapes mark the specific disease categories of the cases.

