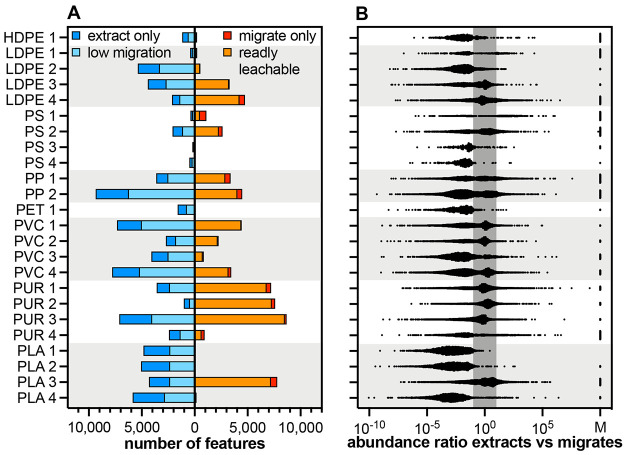
Figure 3.
Numbers of chemical features migrating from plastic products (A) and ratios of the abundance of each feature in the extract and the migrate (B). The left side of each graph represents features with no/low migration (migration ratio of <0.1), the right side represents features that are readily leachable, that is, they are only detected in migrates (M in B) or migrating with a ratio of >0.1. The dark gray band in (B) highlights the area in which abundance of features is similar (maximally 10-fold lower or higher) in the extracts and migrates.

