
Figure 3.
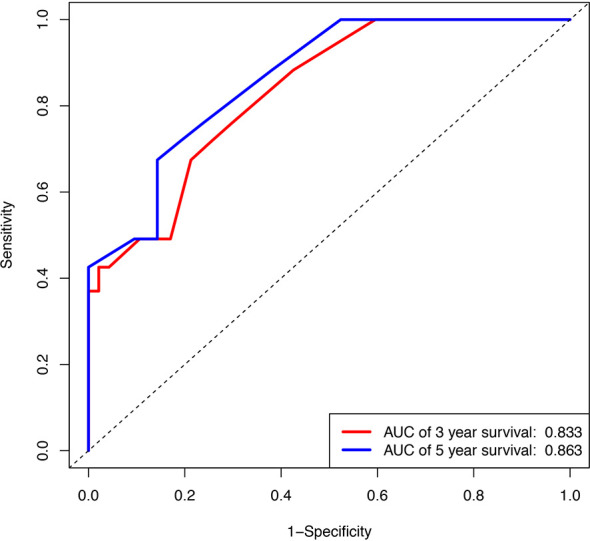
Internal validation of the nomogram to predict OS likelihoods in patients using ROC curve. Blue line, ROC curve of three years survival; Red line, ROC curve of five years survival.
Official websites use .gov
A
.gov website belongs to an official
government organization in the United States.
Secure .gov websites use HTTPS
A lock (
) or https:// means you've safely
connected to the .gov website. Share sensitive
information only on official, secure websites.
Internal validation of the nomogram to predict OS likelihoods in patients using ROC curve. Blue line, ROC curve of three years survival; Red line, ROC curve of five years survival.