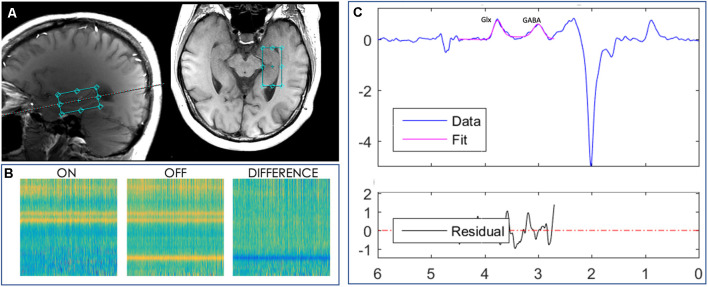
Figure 1.
Localized images and representative MR spectra from a 2 × 2 × 4 cm3 voxel manually placed in the right hippocampus of a subject. (A) Axial and sagittal planes showing the hippocampal voxel, outlined in aqua, from one study participant’s MPRAGE T1-weighted image. (B) Loadings for the GABA edited difference spectrum. (C) Representative model fitting showing Glx (a combination of glutamate and glutamine) and GABA spectrum peaks, representing the GABA signal, from the same subject. The blue line represents the actual edited spectrum, whereas the overlaid pink line is the model of best fit. The residual is shown in the black curve below the modeling plot.

