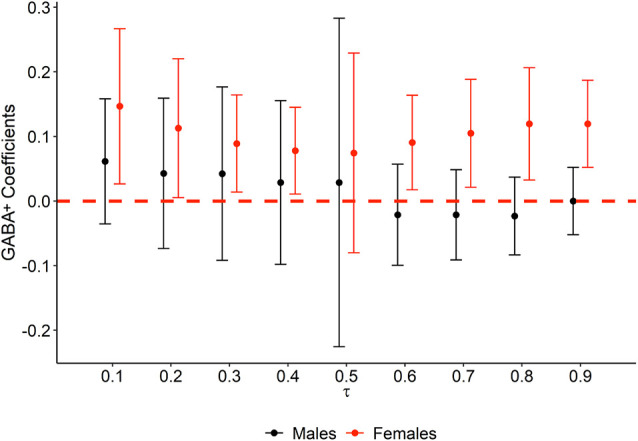
Figure 3.

Quantile regression plot of GABA+ statistical effect on memory performance at each decile of TBR accuracy, by sex. The variation of GABA+ regression β coefficients (y axis) obtained from quantile regression models is represented at each decile (x axis). Colors represent males (black) and females (red). The red dashed line is set at 0, and thus error bars not crossing the red dashed line represent statistically significant associations.
