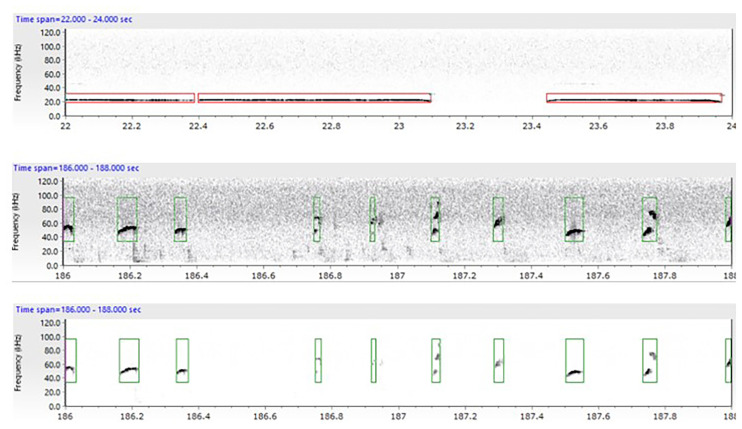
Figure 3.
Example spectrogram extracted from the UltraVox XT version 3.2.108 program depicting both 22 kHz (upper image) and 50 kHz calls (lower images). The spectrogram shows the calls emitted in a specific timeframe while being tested in the liberation task. Each spectrogram depicts the communication between the two animals. The red boxes indicate the automatic measurements of calls in the 18–32 kHz frequency range (alarm calls) while the green boxes indicate calls in the 32–96 kHz frequency range (appetitive calls). In the lower panel background noise has been removed.

