Figure 1.

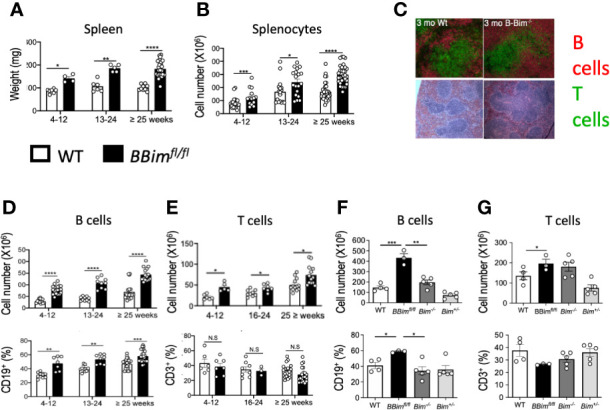
B cell lineage-specific deletion of Bim resulted in expansion of splenic B and T cells. Spleen weights and splenocyte numbers, B cells and T cells were identified by FCM using established cell surface markers as described in materials and methods. (A) Spleen weights at different ages from BBimfl/fl and WT mice. (B) Total splenocyte numbers. (C) Immunofluorescence image showing splenic follicles (top panel) stained for B220+ B cells (red) and CD3+ T cells (green) and H&E images (bottom panel) showing follicular structure and lymphocyte organization (top panel) of spleens from 3 month old mice. (D) Numbers (top panel) and proportions (bottom panel) of splenic (D) B cells and (E) T cells. (F, G) Quantification of splenic B and T cells in BBimfl/fl relative to Bim-/- mice. Numbers (top panel) and proportions (bottom panel) of (F) B cells and (G) T cells. Data is representative of >3 independent experiments. Not significant (N.S) P > 0.05, *P ≤ 0.05, **P ≤ 0.01, ***P ≤ 0.001, ****P ≤ 0.0001, calculated by Students T- test and Mann-Whitney non-parametric test.
