Figure 2.
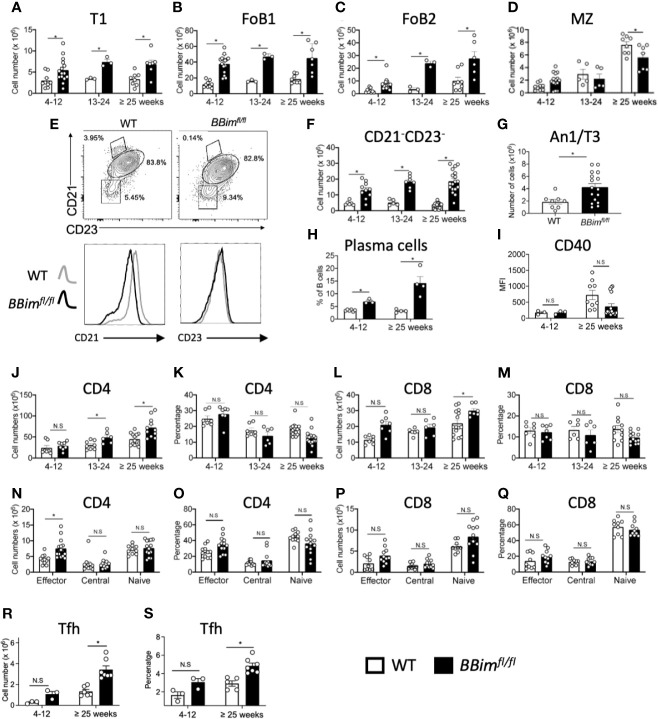
BBimfl/fl mice have expanded effector B and T cell populations in the spleen. Splenic B and T cell subpopulations were identified by FCM using established cell surface markers described in materials and methods. (A–D) Numbers of T1, FoB1, FoB2 and MZ plus pre-MZ B cells subsets in BBimfl/fl and WT mice in the indicated age groups. (E) Representative FCM plots showing gating strategy to quantify CD21 and CD23 double negative (DN) B cells within total B cells (top panels) and histograms displaying CD21 and CD23 expression showing reduced CD21 expression in B cells from BBimfl/f l relative to WT mice (bottom panels). (F) Numbers of CD21- CD23- DN B cells in BBimfl/fl and WT mice. (G) Numbers of anergic (An1/T3) B cells. (H) Numbers of plasma cells. (I) MFI values of CD40 in B cells (J–Q) Quantification of splenic CD4 and CD8 T cell populations on CD3+ gated cells in the ≥ 25 week old BBimfl/fl and WT mice. Representative graphs displaying (J) CD4 T cell numbers and (K) proportions and (L) CD8 T cell numbers and (M) proportions. (N) Cell numbers and (O) proportions of CD4 effector, central memory and naïve CD4 subsets. (P) CD8 T cell numbers and (Q) proportions of CD8 effector, central memory and naïve T cells. (R) Cell numbers and (S) percentages of Tfh cells. Data is representative of >3 independent experiments. Not significant (N.S) P > 0.05, *P ≤ 0.05, calculated by Students T- test and Mann-Whitney non-parametric test.

