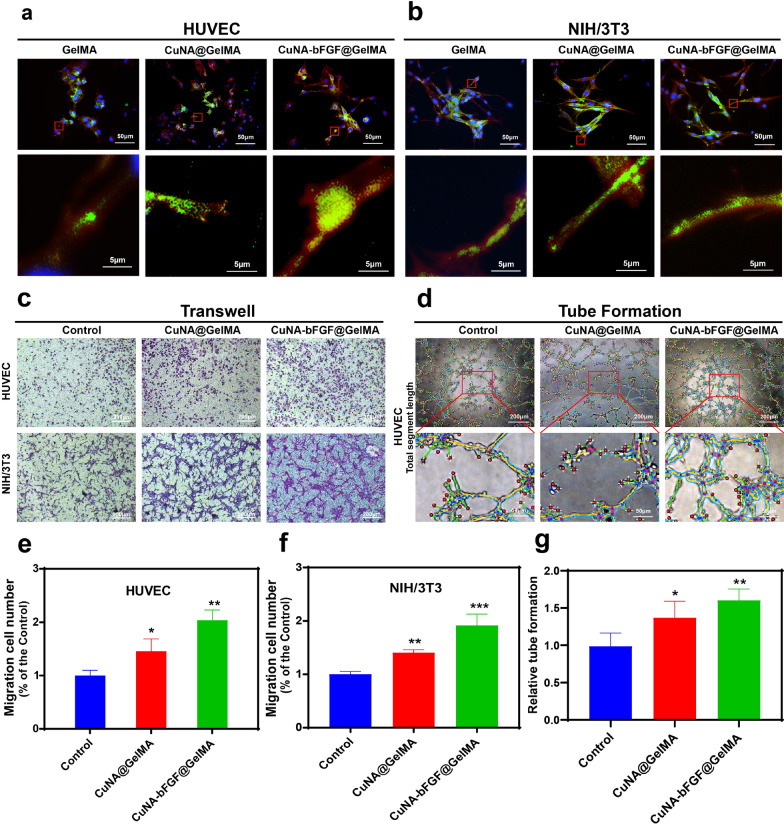
Fig. 6.
Cell attachment and spreading behavior, migration and tubule formation activities Cellular merged fluorescent images of HUVEC (a) and NIH/3T3 cells (b) on GelMA, CuNA@GelMA and CuNA-bFGF@GelMA hydrogels after 2 days post-seeding. F-actin (red), vinculin (green), nuclei (blue). c The migration evaluation of different ionic extraction on HUVEC and NIH/3T3 cells after incubation for 24 h by the transwell method. d The tube formation of HUVEC on matrigel after incubation with ionic extraction for 4 h. The migration number of HUVEC (e) and NIH/3T3 cells (f) compared to the control group. g The relative tube formation of HUVEC cultured in different ionic extraction. Data are expressed as mean ± SD (n = 3). (*p < 0.05, **<0.01, **<0.001 compared to the control)

