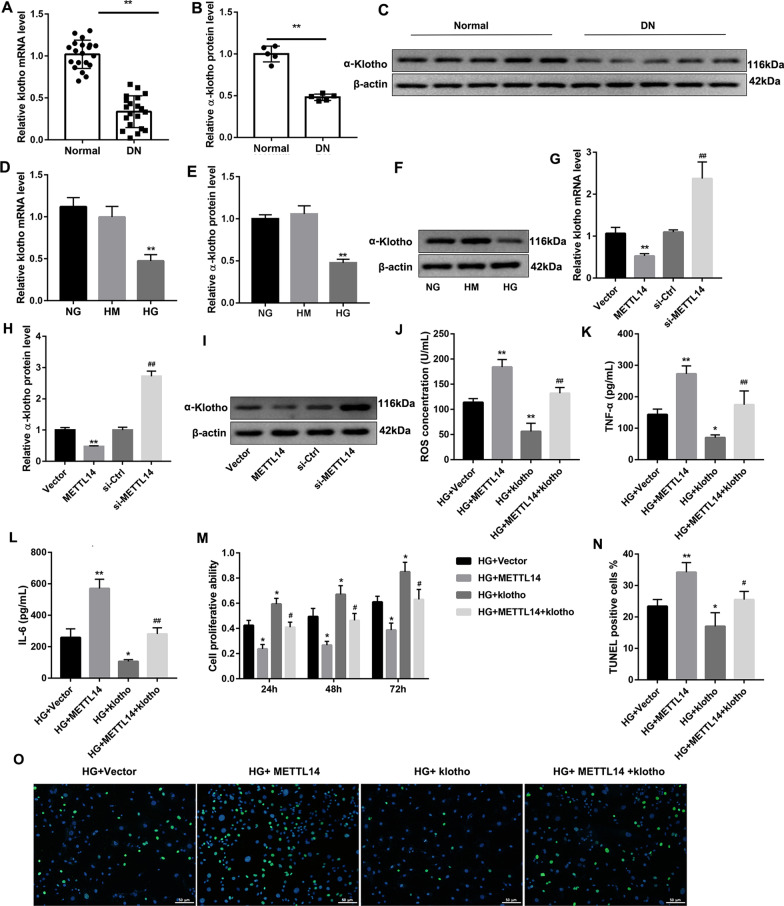
Fig. 3.
METTL14 down-regulated α-klotho expression. A–C Expression of α-klotho in kidney tissues of normal people and diabetic nephropathy patients was examined by qRT-PCR and western blot. Data are presented as the mean ± SD (n = 20); **P < 0.01 vs. Normal. D–F Expression of α-klotho in glomerular endothelial cells was examined by qRT-PCR and western blot. **P < 0.01 vs. HG. G–I Expression of α-klotho after overexpression or inhibition of METTL14. **P < 0.01 vs. Vector; ##P < 0.01 vs. si-Ctrl. J–L The levels of ROS, TNF-α and IL-6 were detected by ELISA. M Cell proliferation was assessed by CCK-8. N–O Cell apoptosis was analysed by TUNEL staining. *P < 0.05, **P < 0.01 vs. HG + Vector; #P < 0.05, ##P < 0.01 vs. HG + METTL14. Data are presented as the mean ± SD (n = 3)

