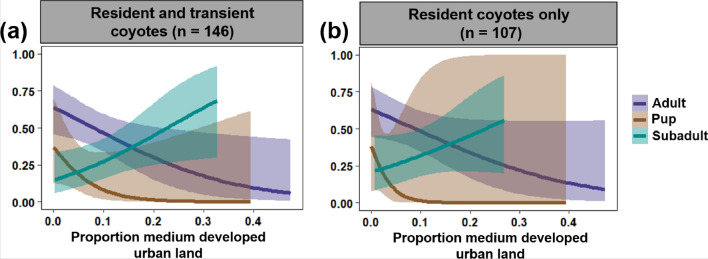
Fig. 4.
Relationship between infection risk and the proportion of medium developed urban land in coyote home ranges by age class. Panel a includes both resident and transient coyotes (n = 146), and panel b resident coyotes only (n = 107). Lines are mean estimates of infection risk (i.e., probability of infection) by proportion of medium developed urban land in coyote home ranges. The shaded bands are 95% confidence intervals. Coyote home ranges were estimated using 95% minimum convex polygons (95% MCPs). For results using a-LoCoH, see Additional file 1: Figure S2

