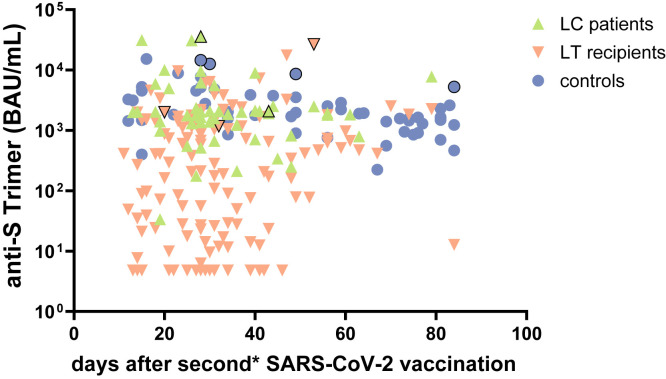
Supplementary Figure 8.
Humoral immune response over time after second vaccination. Comparison of humoral immune response according to the time point after second SARS-CoV-2 vaccination in cirrhotic patients (green ascending triangles), LT recipients (orange descending triangles), and controls (blue dots). Convalescents were indicated with a black border line and have received 1∗ mRNA booster vaccination. Detection by anti-S trimer titers (BAU/mL).

