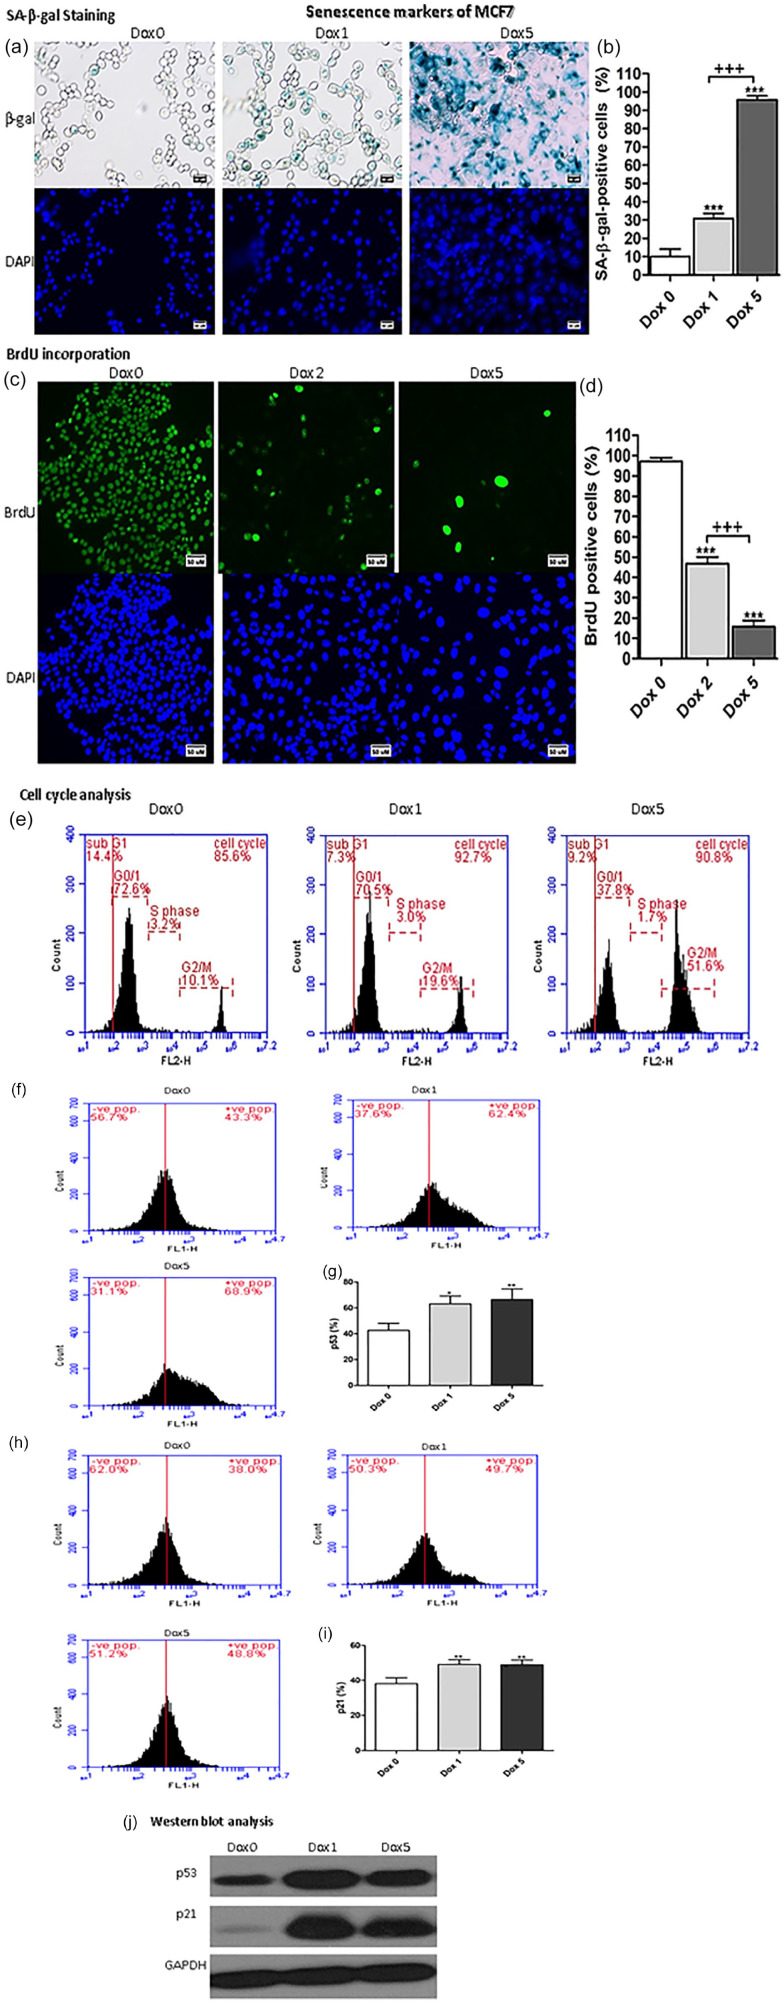
Figure 2.
Senescence markers of Sen-MCF7. (a) SA-β-gal-positive cells of Sen-MCF7 cells. The scale bar is 50 µm. (b) SA-β-gal-positive cells percentages. (c) BrdU incorporation for Sen-MCF7 cells. Magnification 200×. The scale bar is 50 µm. (d) BrdU positive cells percentages. (e) representative cell cycle analysis. (f) p53 protein expressions by flow cytometry of Sen-HCT116 cells. (g) p53 protein expression percentages. (h) p21 protein expressions by flow cytometry of Sen-HCT116 cells. (i) p21 protein expression percentages. (j) Western blot analysis of p53 and p21.The data were analyzed with 1-way ANOVA (Tukey’s Multiple Comparison Test). Error bars represent mean ± SD. *P < .05, **P < .01, and ***P < .001 versus Day 0 (control). +++P < .001 versus Dox 1 (SA-β-gal) and Dox 2 (BrdU). Dox 0 refers to untreated cells. Dox 1 refers to day 1 after Dox treatment. Dox 5 refers to day 5 after Dox treatment. All assays were done in triplicate at least.

