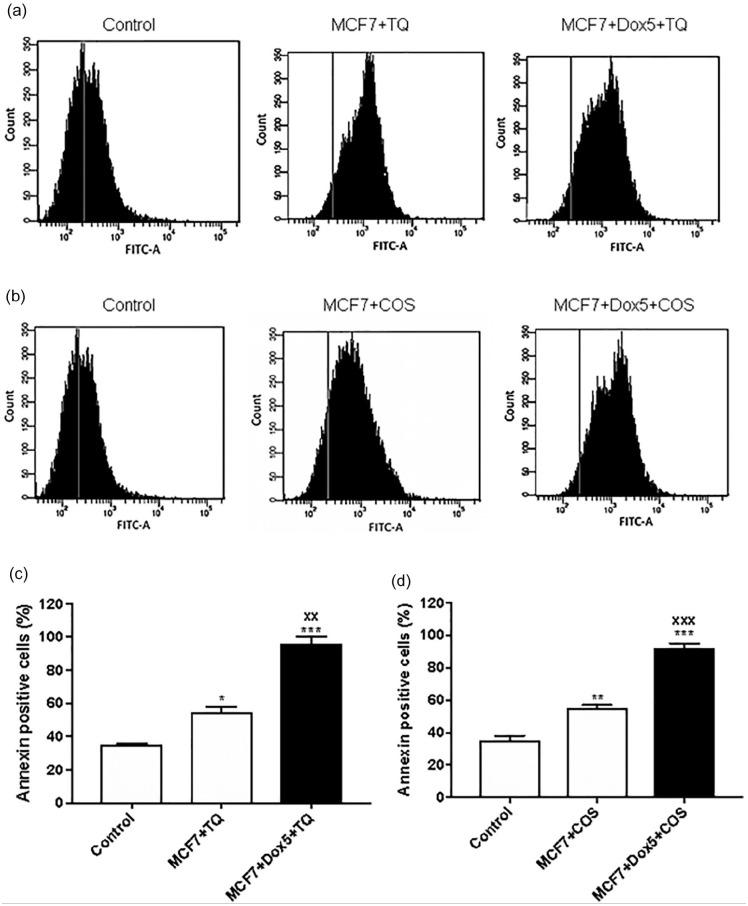
Figure 9.
Annexin-V of proliferative MCF7, Sen-MCF7 cells by flow cytometry. (a) Histogram of MCF7 and Sen- MCF7 treated with 50 µM thymoquinone (TQ) for 24 hours. (b) Histogram of MCF7 and Sen-MCF7 treated with 30 µM costunolide (COS) for 24 hours. (c) Percentages of annexin-v positive cells of MCF7 and Sen-MCF7 treated with 50 µM TQ for 24 hours. (d) Percentages of annexin-v positive cells of MCF7 and Sen-MCF7 treated with 30 µM COS for 24 hours. The data were analyzed with 1-way ANOVA (Tukey’s Multiple Comparison Test). Error bars represent mean ± SD. *P < .05, **P < .01, and ***P < .001 versus control. xxp < .01 and xxxP < .001 versus MCF7 + TQ or MCF7 + COS. Control refers to proliferative-untreated MCF7. MCF7 + TQ refers to MCF7 treated with 50 µM TQ for 24 hours. MCF7 + COS refers to MCF7 treated with 30 µM COS for 24 hours. MCF7 + Dox5 + TQ refers to Sen- MCF7 with 100 nM Dox for 5 days, then treated with 50 µM TQ for 24 hours. MCF7 + Dox5 + COS refers to Sen-MCF7 with 100 nM Dox for 5 days then treated with 30 µM COS for 24 hours. TQ, thymoquinone. COS, costunolide. All assays were done in triplicate at least.

