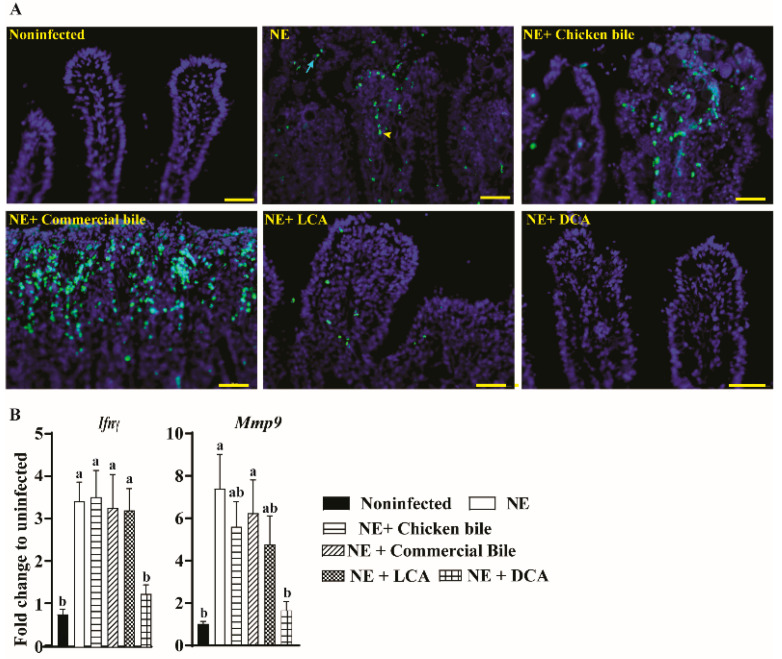
Figure 2.
Cohorts of broiler chickens were fed different bile diets and infected as in Figure 1. (A) Representative images of the TUNEL assay showing cell death at the late stage of apoptosis (green dots). Yellow arrowhead: apoptotic immune cells in lamina propria; Green arrow: apoptotic epithelial cells. (B) Ileal Ifnγ and the Mmp9 mRNA qPCR fold-change relative to noninfected birds and normalized to Gapdh. Different letters of a and b mean p < 0.05. The scale bar is 40 μm. Results are representative of 3 independent experiments.

