Fig. 3.
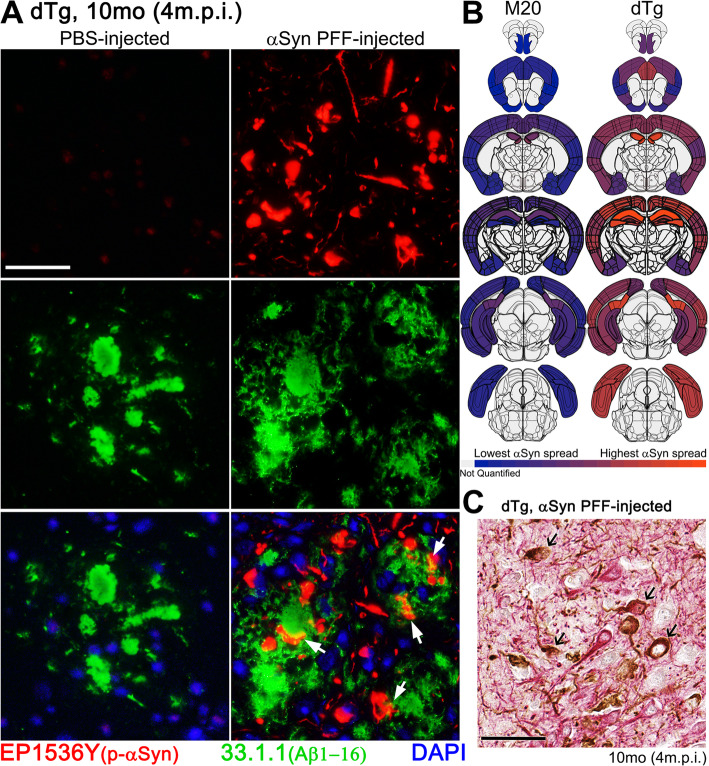
Phosphorylated αSyn-Positive Inclusions Contiguous to Cored Aβ Plaques. A IFA double labeling of phosphorylated αSyn-positive inclusions (EP1536Y; red) and Aβ (1–16) plaques (33.1.1; green) in the cortex, comparing age-matched dTg mice (10-month-old; 4 m.p.i.) injected with PBS or αSyn-PFFs. White arrows depict αSyn inclusions in close proximity to Aβ plaques. B Regional comparison of phosphorylated αSyn-positive pathology between age-matched, αSyn PFF-injected M20 and dTg cohorts. The level of αSyn pathology is illustrated by the color change from blue (minimum of total counted 81A positive inclusions) to orange (maximum of total counted 81A positive inclusions). Light gray indicates regions were not quantified during this study. C Double staining of αSyn PFF-injected 10-month-old (4 m.p.i.) dTg mice with anti-NFL (red) and anti-αSyn 81A (brown) antibodies in the cortex. Arrows indicate neuronal cell bodies labelled for NFL and positive for αSyn inclusions. Scale bars: 50 μm

