Figure 1.

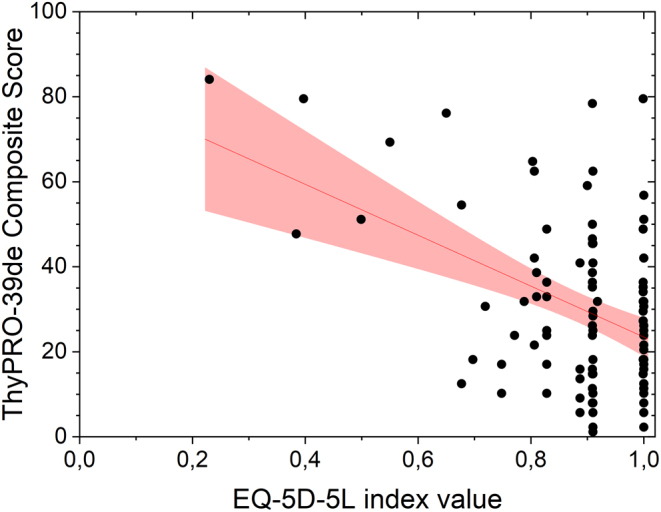
Scatterplot of the composite score from the ThyPRO-39-de and the index score from the EQ 5D-5L. The line represents the regression of y on x, and the gray area denotes the 95% CI.

Scatterplot of the composite score from the ThyPRO-39-de and the index score from the EQ 5D-5L. The line represents the regression of y on x, and the gray area denotes the 95% CI.