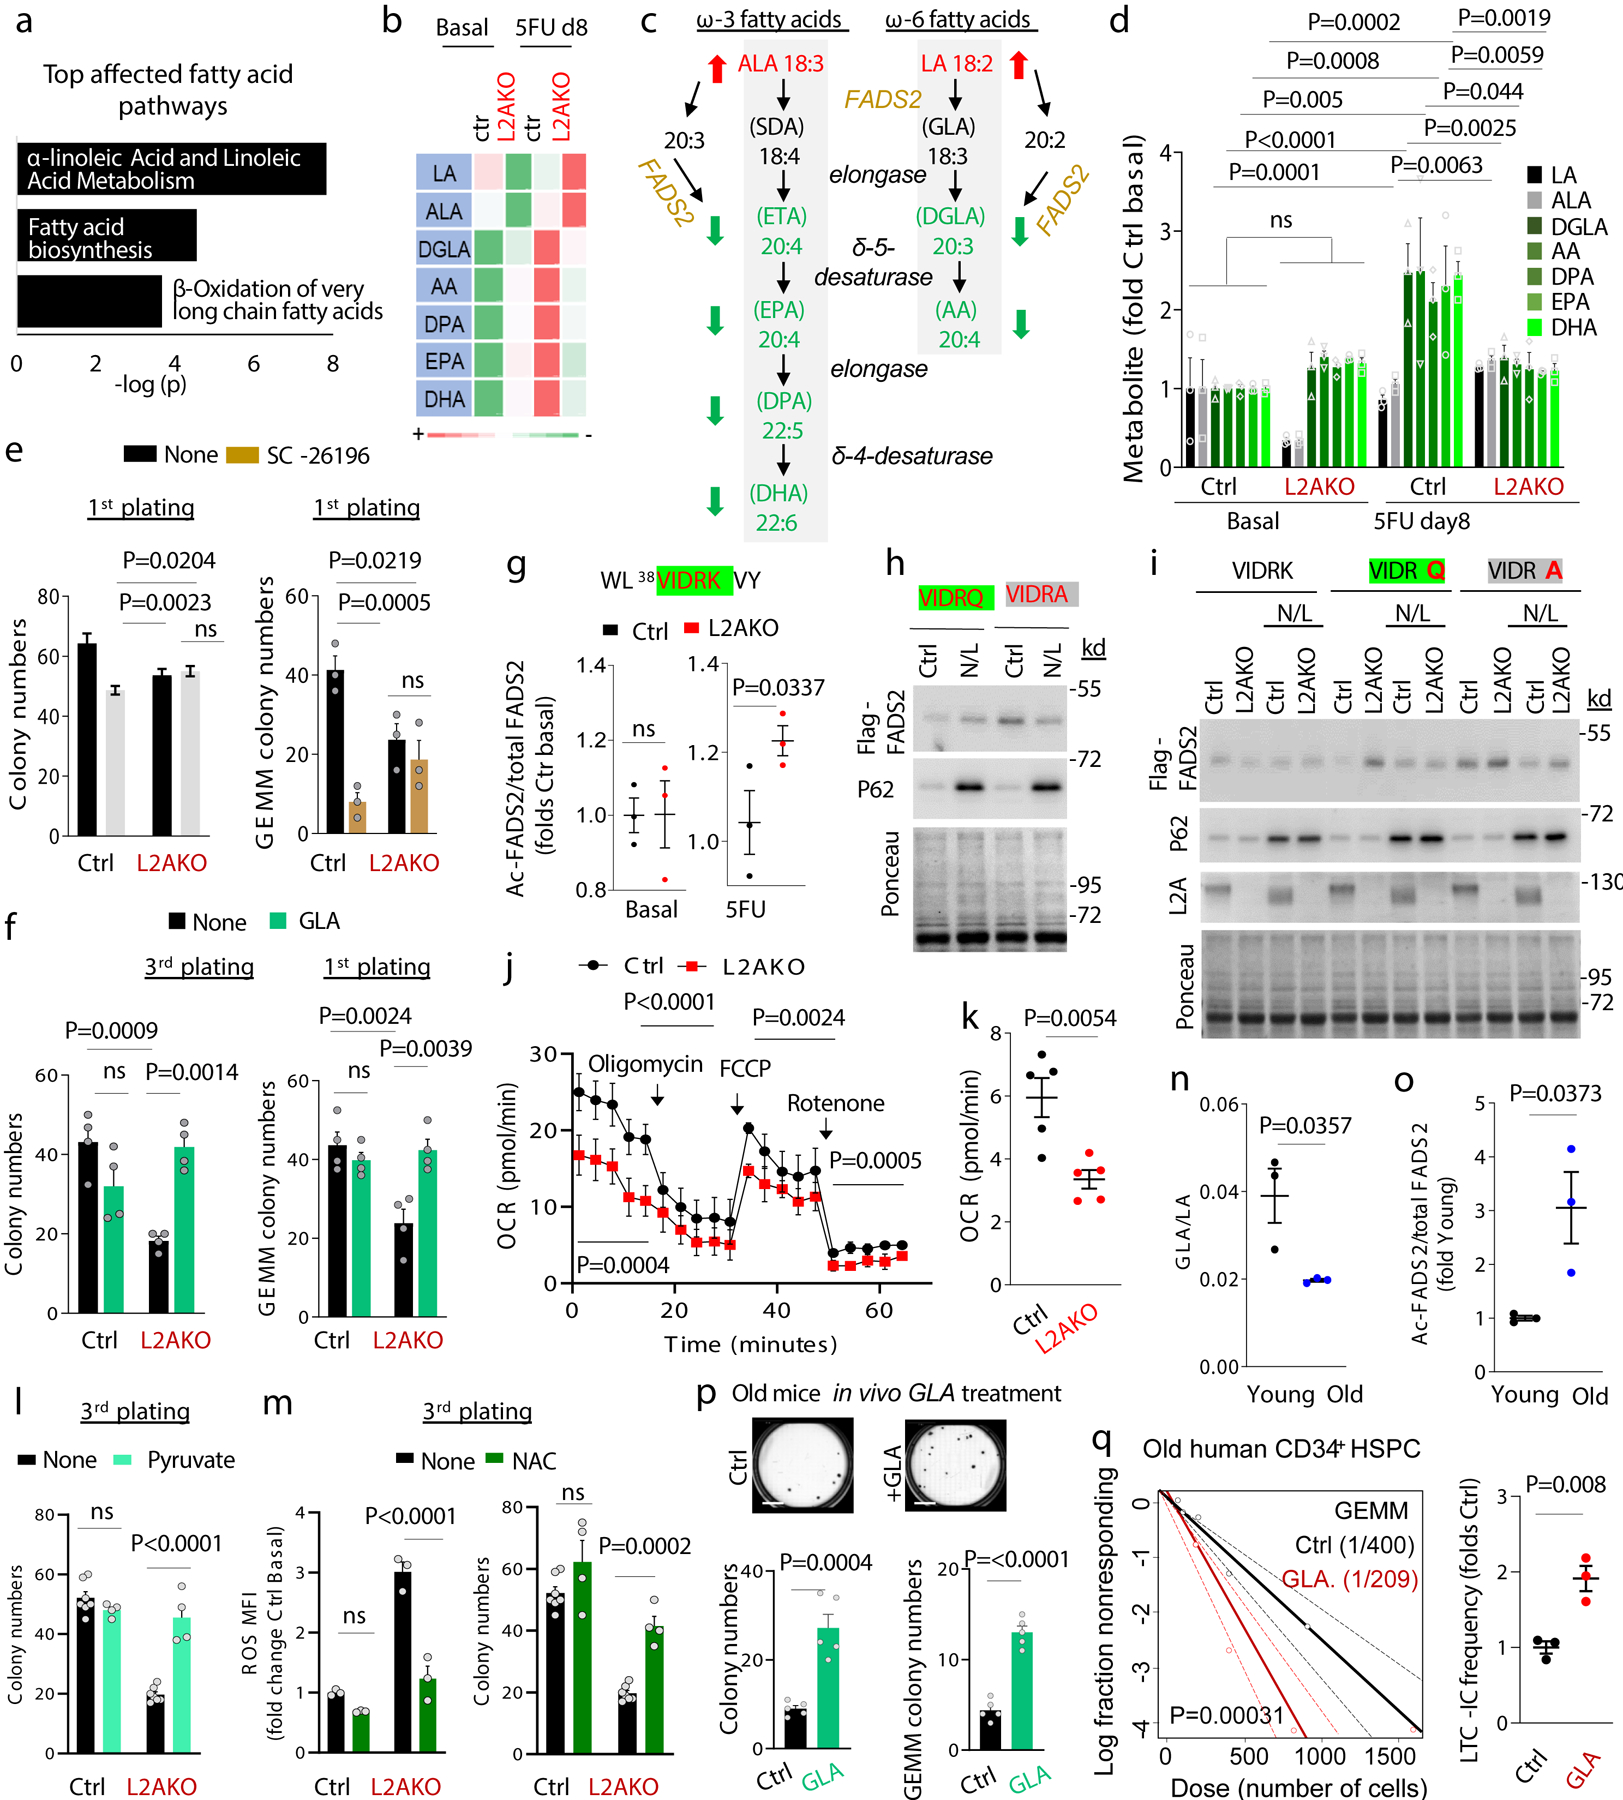
Fig. 3. CMA increases linoleic acid metabolism upon HSC activation.

a, Top lipid metabolism pathways identified from enrichment analysis of metabolites as different between control and L2AKO LSK cells 8 days post 5FU injection. b, Heat map of substrate and metabolite abundance in the linoleic acid and α-linolenic metabolism in the indicated conditions. c, Scheme of linoleic and α-linolenic fatty acid metabolism pathway showing the increased (red arrow) and decreased (green arrow) metabolites in L2AKO LSK cells comparing with Ctrl cells in 5FU-activated conditions. d, Levels of substrates (black, gray) and downstream metabolites (green) of the linoleic acid and α-linolenic metabolism relative to those in unstimulated control cells. n= 9 mice in 3 different experiments. Significant differences with control untreated are marked with * and between L2AKO basal and 5FU treated with †. e, Total colony numbers (left) and number of immature, multipotent colony-forming unit-granulocyte/ erythroid/macrophage/megakaryocyte CFU-GEMM (right) in the first plating from Ctrl and L2AKO HSC treated or not with the FADS2 inhibitor SC-26196 (SC). n=3 independent experiments. f, Total colony numbers in the 3rd plating (left) or number of CFU-GEMM colonies in the first plating (right) from Ctrl and L2AKO HSC treated or not with γ-linolenic acid (GLA). n=4 independent experiments. g, Predicted CMA-targeting motif in FADS2 (green) generated by acetylation of 42K (g top) and analysis of the acetylation level of this peptide detected by mass spectrometry Ctrl and L2AKO LSK cells in basal and 5FU activated conditions (g bottom). n=3 mice. h,i, Immunoblot for Flag of Ctrl (h) and L2AKO (i) ex vivo expanded HSC expressing Flag-myc tagged FADS2 wild type (VIDRK) or mutated as indicated at the top (VIDRQ or VIDRA) treated or not with NH4Cl/Leupeptin (N/L). For gel source data, see supplementary Figure 1. j, Oxygen consumption rate (OCR) in Ctrl and L2AKO LSK cells at day 8 after 5FU injection. Responses to addition of oligomycin (Oligo), FCCP and rotenone (Roteno) are shown. n=5 independent experiments. k, Quantification of mitochondrial respiration from fatty acid β-oxidation (etomoxir-sensitive) in Ctrl and L2AKO LSK cells. n=5 independent experiments. l, Total colony numbers in 3rd plating from both Ctrl and L2AKO HSC treated or not with Methyl-pyruvate (5mM) starting from the 1st plating. n=7 (None) and 4 (Methyl-pyruvate) independent mice. m, Quantification of MFI of ROS+ cells (left) and total colony numbers (right) in the 3rd plating of Ctrl or L2AKO HSC untreated or supplemented with NAC from the 1st plating. n=7 (None) and 4 (NAC) mice. n, Ratio of γ-linolenic acid (GLA) and linoleic acid (LA) in LSK cells from young and old mice calculated from the metabolomics data. n= 9 mice in 3 different experiments. o, Ratio of K42 acetylated and total FADS2 peptide in LSK from young and old mice calculated from the mass spectrometry analysis. n= 9 mice in 3 different experiments. p, Total colony numbers (left) and number of CFU-GEMM colonies (right) in the colony formation assay with HSC cells from old (22m) mice daily injected with either saline or GLA (1mg/kg bw) for 7 weeks. Representative images of wells with Ctrl or GLA treated cells are shown on the top. n=5 mice per group. q, LTC-IC assay according to GEMM colonies from Ctrl and GLA treated human CD34+ cells from old (>65 year) multi-myeloma patients. n=2 patients. Two-way ANOVA test followed by Tukey’s (d,f) or Sidak (e,l,m) multiple comparison post-hoc test, unpaired t-tests (g,k,n,o,p), time point paired t-test (j), and Chi-square test (q) were used for the statistics. P<0.05 (*), 0.01 (**), 0.001(***), 0.0001(****). ns: no statistical significance.
