
Extended Data Fig. 2. CMA upregulation during HSC activation.
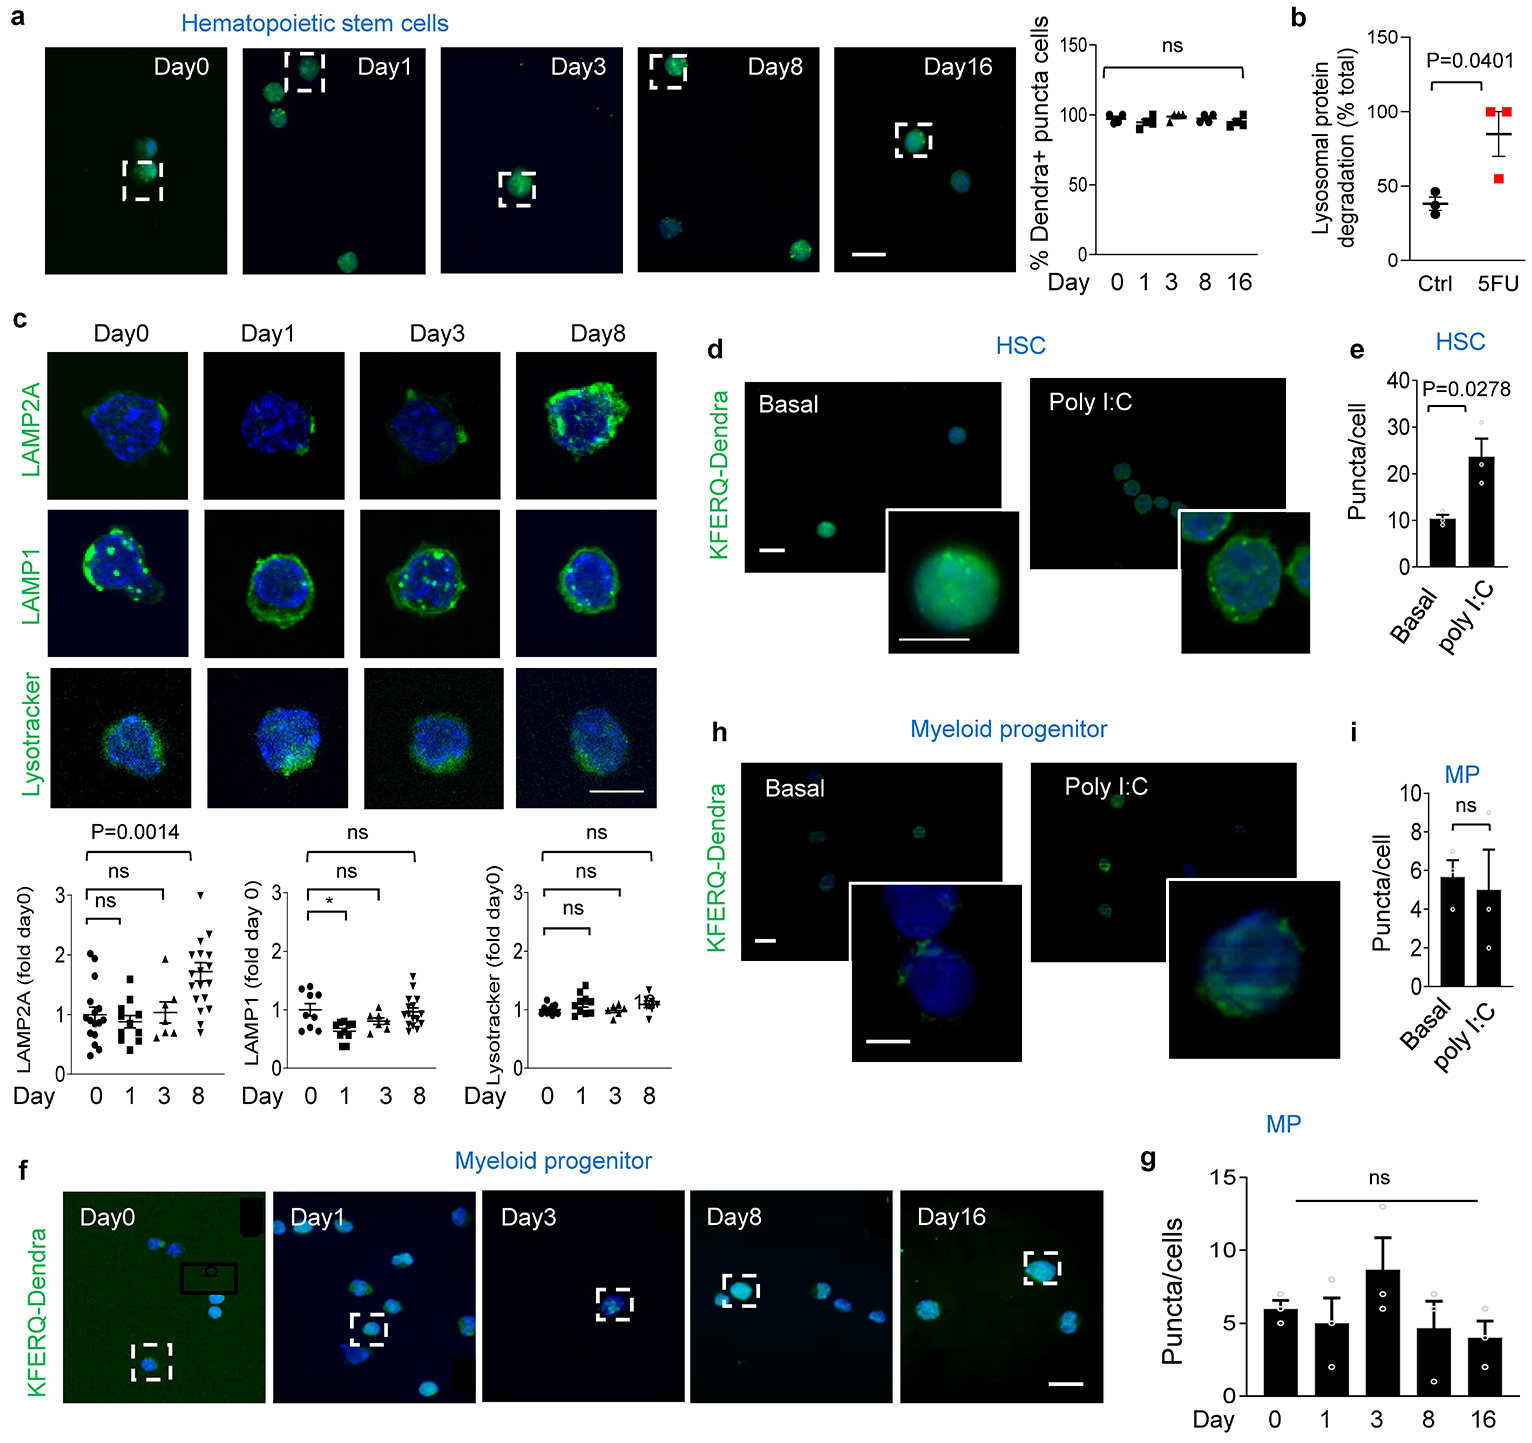
a, Left: Full fields of the images shown at higher magnification in Fig. 1b. Right: HSC positive for Dendra puncta. n=4 mice per group. CMA+ cells = cells with >2 Dendra+ puncta. b, Lysosomal proteolysis of long-lived proteins in HSC untreated (Ctrl) and 8 days post 5FU injection. n=3 independent experiments. c, Immunostaining for LAMP2A, LAMP1 and LysoTracker in HSC from mice before and 1, 3 and 8 days after single 5FU injection. Top: Representative images. Bottom: Fluorescence intensity. n=16, 11, 7, 19 fields (LAMP2A), 9, 10, 7, 16 fields (LAMP1) and 10, 10, 6, 7 fields (LysoTracker) from 3 mice per group, individual points show average intensity/field. d,e, Dendra fluorescence in HSC from KFERQ-Dendra mice 48h post PolyI:C or vehicle injection (Basal). Representative images and magnified cells (d) and puncta per cell (e), n=3 mice. Individual points show average puncta/field. f,g, Full fields of the images shown at higher magnification in Fig. 1b (f) and number of Dendra+ puncta per cell (g) in myeloid progenitors from KFERQ-Dendra mice before and at the indicated days post 5FU injection. n=3 mice. h,i, Dendra fluorescence in myeloid progenitors from KFERQ-Dendra mice 48h post PolyI:C or vehicle injection (Basal). Representative images and magnified cells (h) and puncta per cell (i), n=3 mice. Data shows individual values and mean ± SEM. Unpaired two tailed t tests (b,e,i) and one-way ANOVA with Tukey’s post-hoc test (a,c,g) were used. P values are shown and statistical analysis is in data source. ns: no statistical significance.