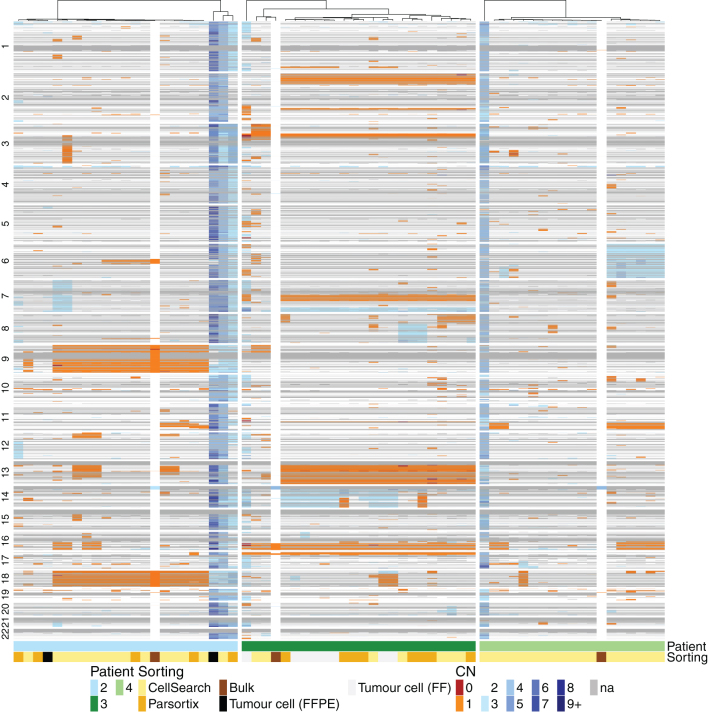
Figure 2.
Comparison of low-resolution whole-genome copy number profiles for CTCs and bulk tissue reveals reproduction of the majority of the CNV from the formalin-fixed paraffin-embedded (FFPE) and fresh frozen (FF) tissue in CTC samples. Unsupervised hierarchical clustering heat map of each analyzed individual CTC and tissue sample based on CNV from three SINET patients. Each patient is depicted with one color as shown on the phenobar at the bottom of the heat map. Individual CTCs are categorized according to enrichment method and tissue into bulk vs single-cell FFPE (see key). Chromosomal CNV is shown from top to bottom for each individual cell or sample; copy number gains are depicted in blue, losses in orange.

 This work is licensed under a