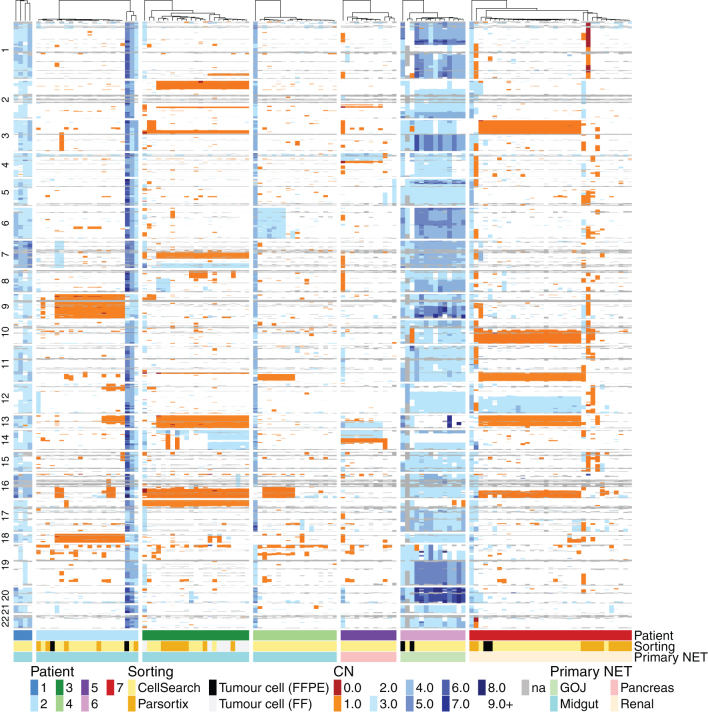
Figure 3.
Individual CTC CNV data depicting complex intrapatient and interpatient genomic diversity. Unsupervised hierarchical clustering heat map of all analyzed CTCs based on CNV across seven patients. Each patient is depicted with one color as shown on the phenobar at the bottom of the heat map along with the cell sorting method and primary NET site.

 This work is licensed under a