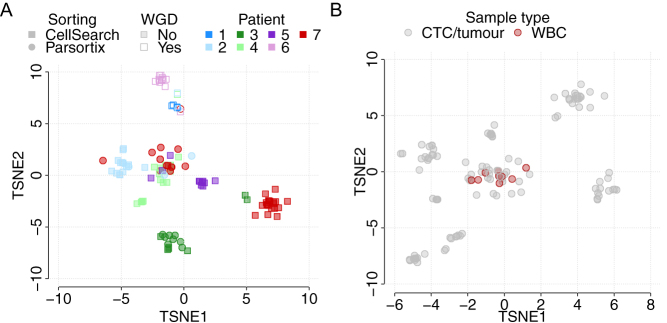
Figure 4.
Relationship between CTCs from all seven NEN patients is revealed through TSNE analysis. (A) Single CTCs from all seven patients are visualized and can be identified by color in the phenobar at the top of the figure. Cells are also depicted according to enrichment strategy (see key). (B) TSNE of all analyzed CTCs and WBC.

 This work is licensed under a