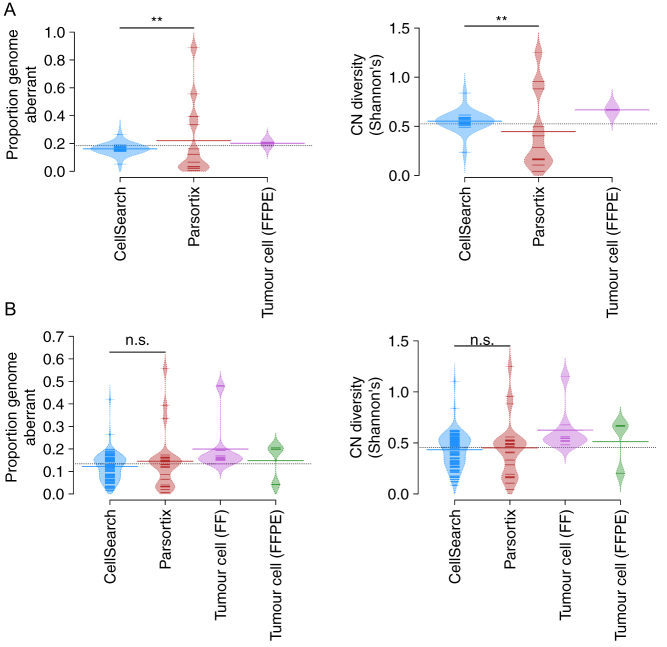
Figure 5.
Distribution plot describing the impact of enrichment strategy in patient 7 (A) and all patients (B) on the proportion of the genome that is aberrant and CNV diversity as quantified by Shannon Index. Each small line represents the described value for a single CTC. Large bars represent mean values.

 This work is licensed under a