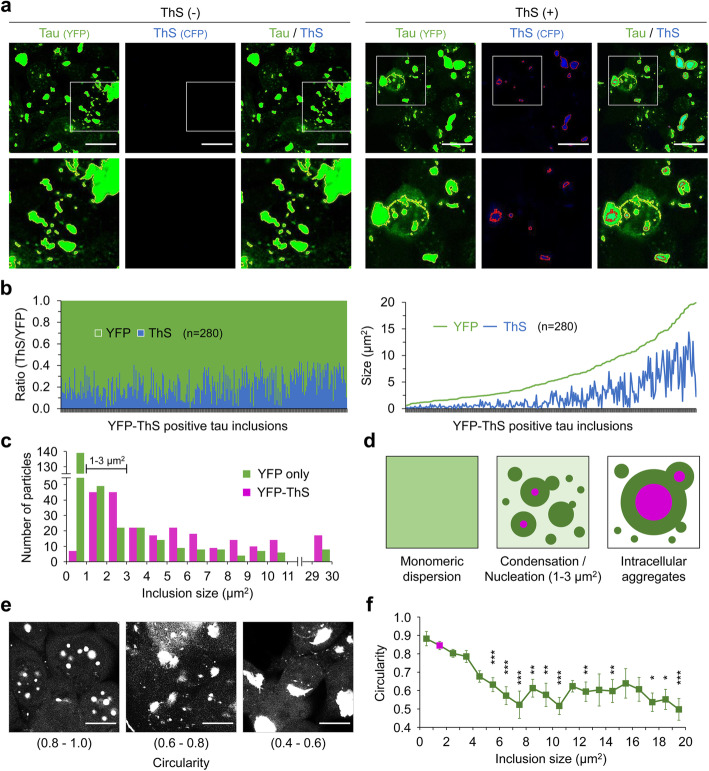
Fig. 3.
Tau assemblies with a concentric structure. a Intracellular aggregates in the ES1 clonal line harboring tau inclusions. Cells were stained with Thioflavin S (ThS), which increased its fluorescence upon binding to the intermolecular β-sheet structure present in the protein aggregates. Tau (outlined in yellow) and ThS (outlined with red) signals were obtained using YFP and CFP channels, respectively, in the absence and presence of ThS staining. Scale bar, 20 μm. b Size measurement of YFP-ThS double-positive tau inclusions observed in a. A total of 280 particles from 8 different areas (160 μm2 for each, see Supplementary Figure 3) were analyzed and presented as a ratio of ThS to YFP (left) and the area of ThS and YFP within each inclusion (right). c Size distributions of YFP-only positive (n = 331) versus YFP-ThS double-positive (n = 317) tau inclusions; the majority of YFP-only positive tau inclusions were smaller than 1 μm2 (n = 139). d Schematic illustrating condensation of monomeric dispersed tau into demixed liquid droplets (dark green). The center and right-hand panels show concentric laminar structures for droplets with ThS-positive interiors, as inferred from the data in panel c. Primary nucleation of tau (magenta) occurs in droplets with a size of 1–3 μm2. Tau aggregates grow by recruiting further condensed tau droplets and droplets including small aggregates. e, f Morphometric analysis of the YFP-ThS double-positive tau inclusions shown in b. e Representing images of circularities. Scale bar, 10 μm. f The mean circularities of the individual inclusions in different size groups were compared to that of the 1–2 μm2 size group, which is dominant in frequency (colored in magenta, n = 45). Error bars represent SEM. *p < 0.05, **p < 0.01 and ***p < 0.001 by one-way ANOVA with Tukey’s multiple comparison test

