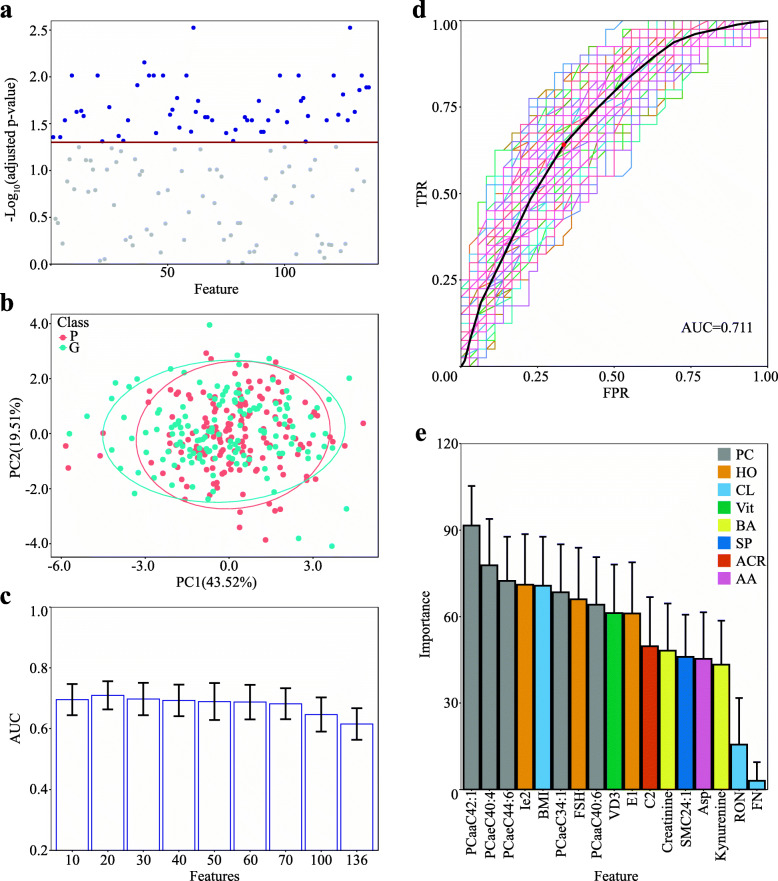
Fig. 3.
Statistical evaluation of the metabolomics indicators that can distinguish groups G and P. A Wilcoxon rank-sum test of the quantities of all the metabolites between groups G and P. Blue dots represent the metabolites with adjusted p values ≤ 0.05; gray dots stand for the metabolites with adjusted p values ≥ 0.05. The red line indicates the cutoff of the adjusted p value at 0.05. B PCA plot of the quantities of all the metabolites and some clinical parameters between groups G and P. The X-axis stands for the first principal component, and the Y-axis denotes the second principal component (G group, n = 145; P group, n = 160). C Dimensional reduction of the features consisting of the metabolites and clinical parameters with rfFuncs. The Y-axis represents the average AUC value of ROC in the RF models, the error bar represents the standard deviations of the AUCs, and the X-axis denotes the selected features. D ROC analysis of the RF model with 17 selected features upon 100 runs. The curves with color represent the ROC results predicted by the model running once. The black curve and the red dot represent the mean ROC curve and the optimal cutoff point, respectively. The Y-axis and X-axis stand for the values of the true positive rate and the false positive rate, respectively. E The averages of feature importance in the RF models with 17 selected features. The Y-axis represents the feature importance in the RF models, in which the error bars are the standard deviations elicited from the importance averages, and the X-axis stands for the features selected. AA, amino acid; ACR, acyl carnitine; BA, biological amine; CL, clinical feature; HO, hormone; PC, phosphatidylcholine; SP, sphingolipid; Vit, vitamin

