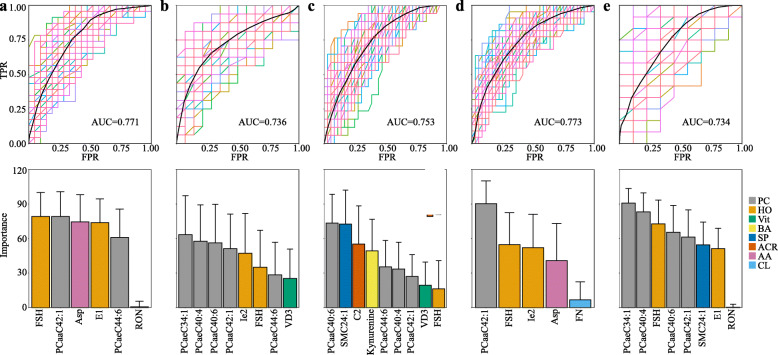
Fig. 4.
Discrimination of embryo quality based on the metabolomic indicators with clinical parameters. Discrimination is based on 2 lines of statistical evidence. The upper panel shows the ROC analysis, and the lower panel shows the averages of feature importance in the RF model. A total of 5 subgroups of the clinical parameters are selected: A the patients aged < 35, B the patients aged ≥ 35, C the patients who received the long protocol, D the patients who received the ultralong protocol, and E the patients who received the GnRH-ant protocol. The X-axis and Y-axis represent the same variables as in Fig. 3D and E

