Fig. 2.

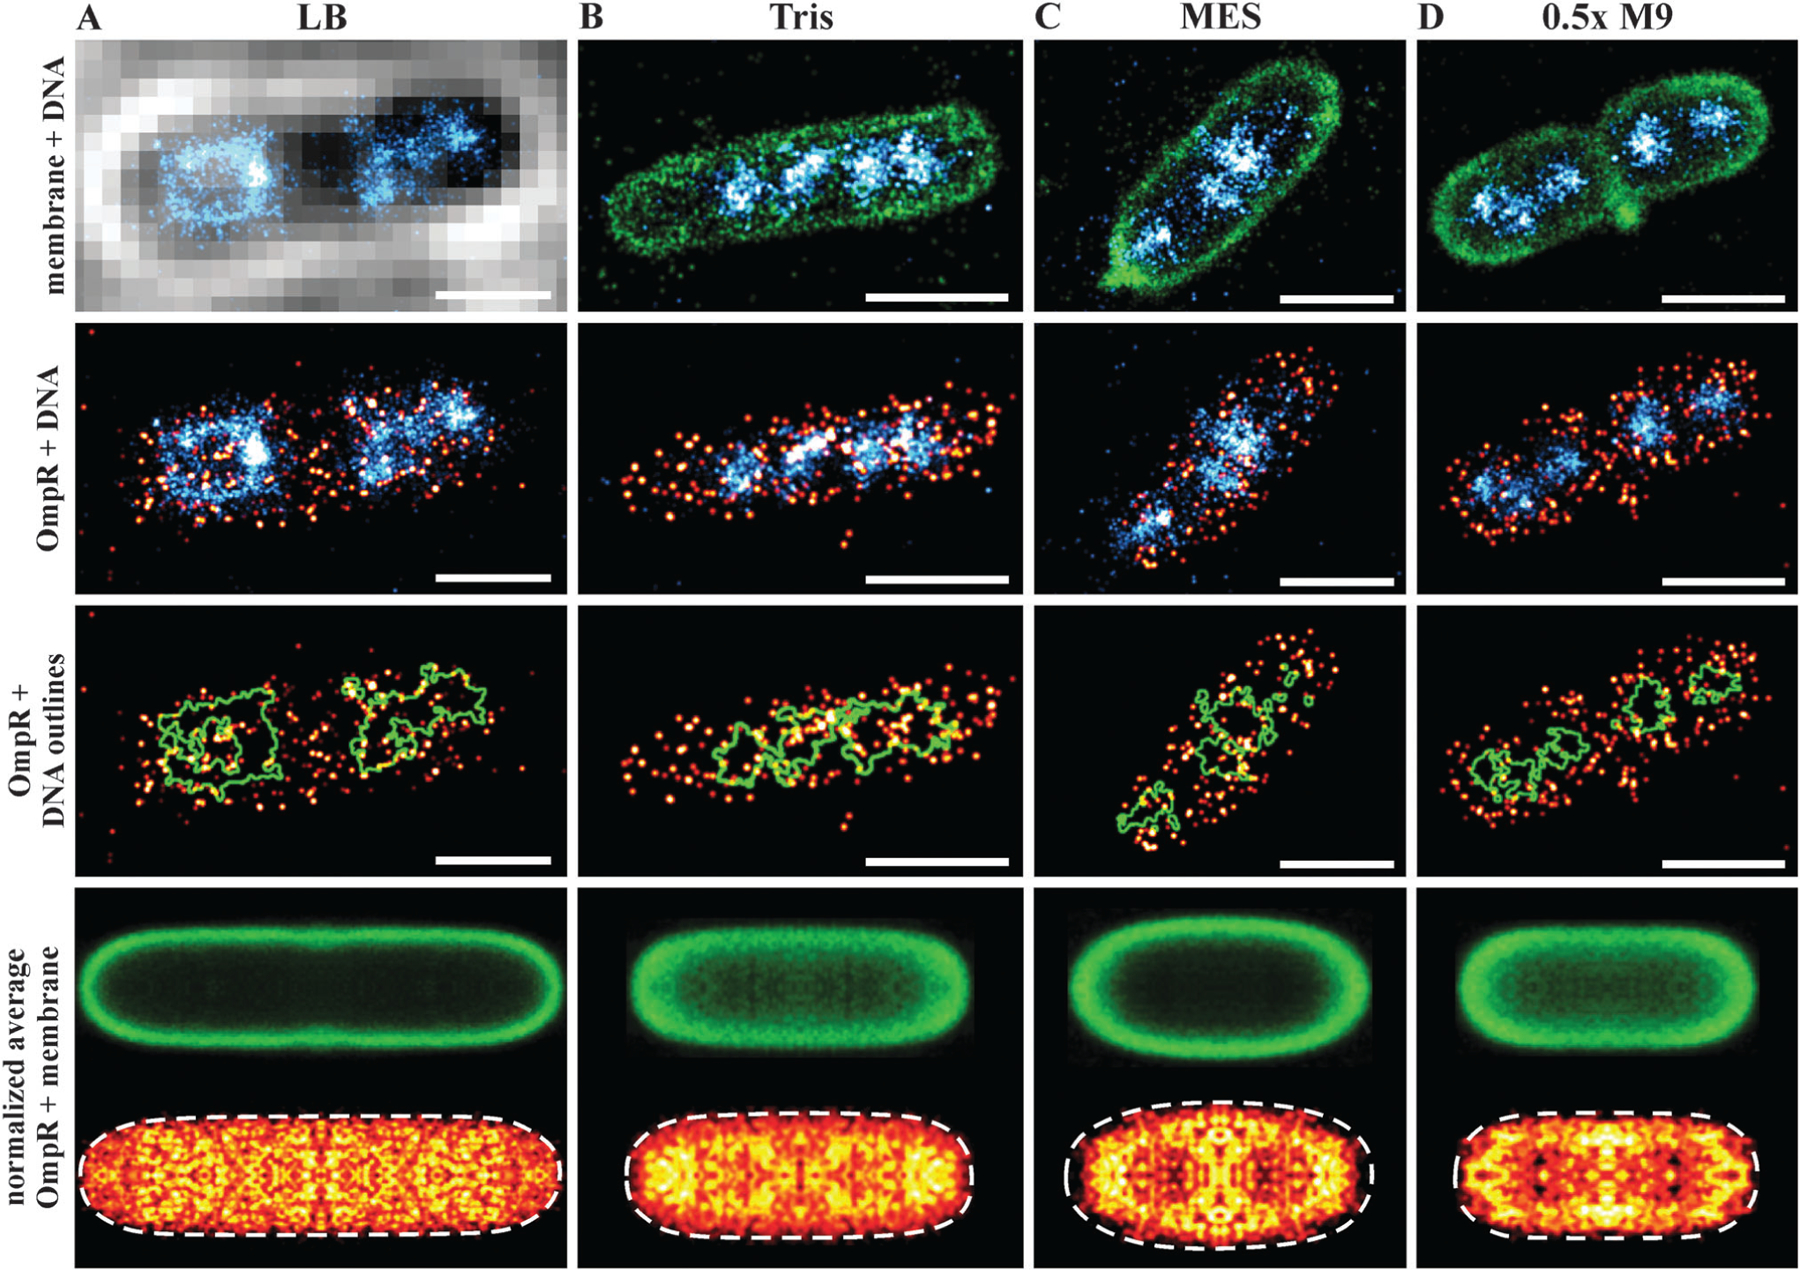
Sequential super-resolution imaging of OmpR–PAmCherry (red hot), bacterial cell membrane (green) and DNA (cyan) in various growth media. LB (A), 100 mM Tris pH 7.2 (B), 100 mM MES pH 5.6 (C) and 0.5× M9 buffer (D). Evidence for DNA compaction is noticeable in the third row panels, where the green outlines the nucleoid edges. OmpR was distributed around the nucleoid edges (outlined in green) in LB, whereas it was more uniformly distributed in Tris buffer. In acidic (MES, pH 5.6) and hypotonic (0.5× M9) conditions, OmpR was recruited to the plasma membrane (scale bar 1 μm). Images in the bottom row show the averaged distribution of the bacterial membrane (green) and OmpR (red hot). These average images indicate a localization of OmpR near the membrane in acid and low osmolality. The recruitment of OmpR to DNA in LB is averaged out because of the nucleoid heterogeneity and asymmetric segregation.74 Cells grown in Tris and 0.5× M9 medium exhibited a smaller cell diameter (~0.8 μm), resulting in projection effects for the membrane average image. The number of images used for averaging was: 19, cell length 3.75–4.25 μm (A), 20 cell length 2.0–2.5 μm (B), 15 cell length 1.75–2.25 μm (C) and 13 cell length 1.5–2.0 μm (D).
