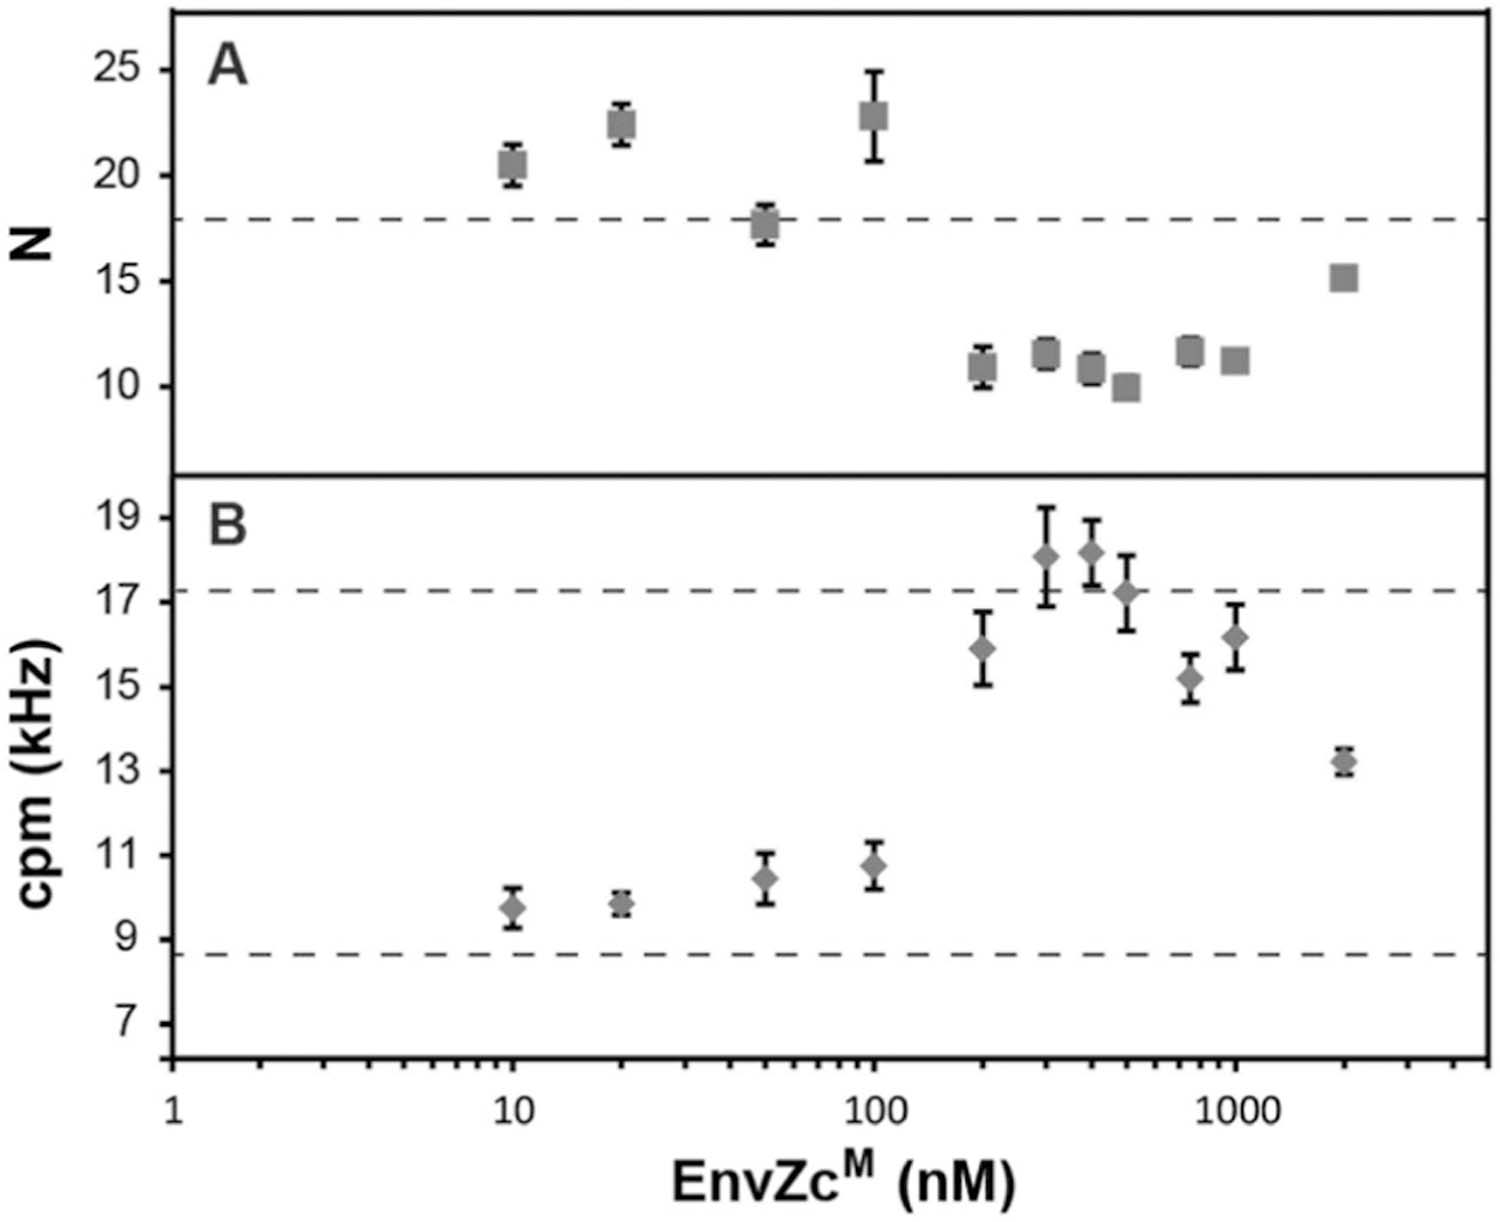
Fig. 6.

Titration of EnvZcM with 280 nM OmpR-A488. (A) The average number of OmpR-A488 (N). The dotted line indicates the value of N for the sample with only OmpR-A488. (B) Count rate per molecule (cpm) values were obtained by normalizing the fluorescence intensity by N. The lower dotted line indicates the cpm for the sample with only OmpR-A488. The upper dotted line indicates the expected cpm value (i.e., twice that of a monomer) of an OmpR-A488 dimer.
