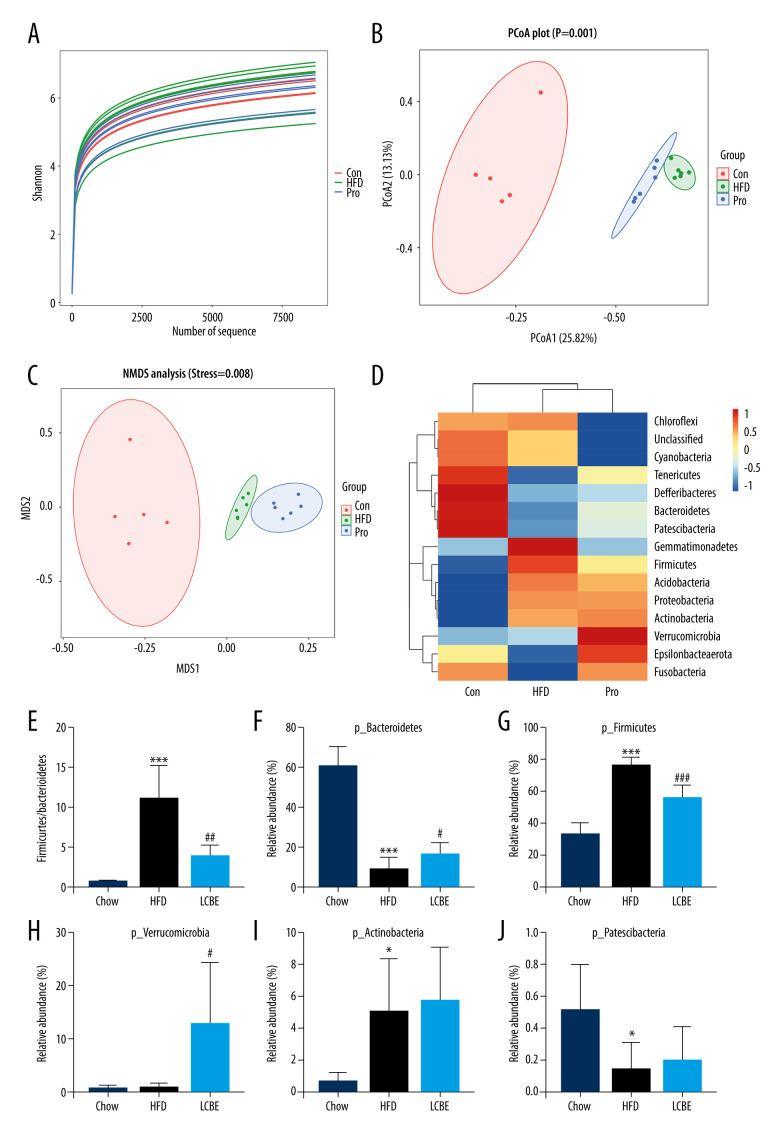
Figure 5.
LCBE modulates the gut microbiota community in mice fed a high-fat diet. (A) Shannon curve of each sample. (B) Principal coordinates analysis (PCoA) of microbial communities based on the unweighted Unifrac cluster for each sample at the phylum level. (C) Non-metric multidimensional scaling (NMDS) of microbial communities based on the unweighted Unifrac cluster for each sample at the phylum level. (D) Relative abundance analysis of microbiota at the phylum level between groups. (E–J) Ratio of Firmicutes to Bacteroidetes and relative abundance of bacteria among groups. * P<0.05, ** P<0.01, *** P<0.001 vs Chow, # P<0.05, ## P<0.01, ### P<0.001 vs HFD.

