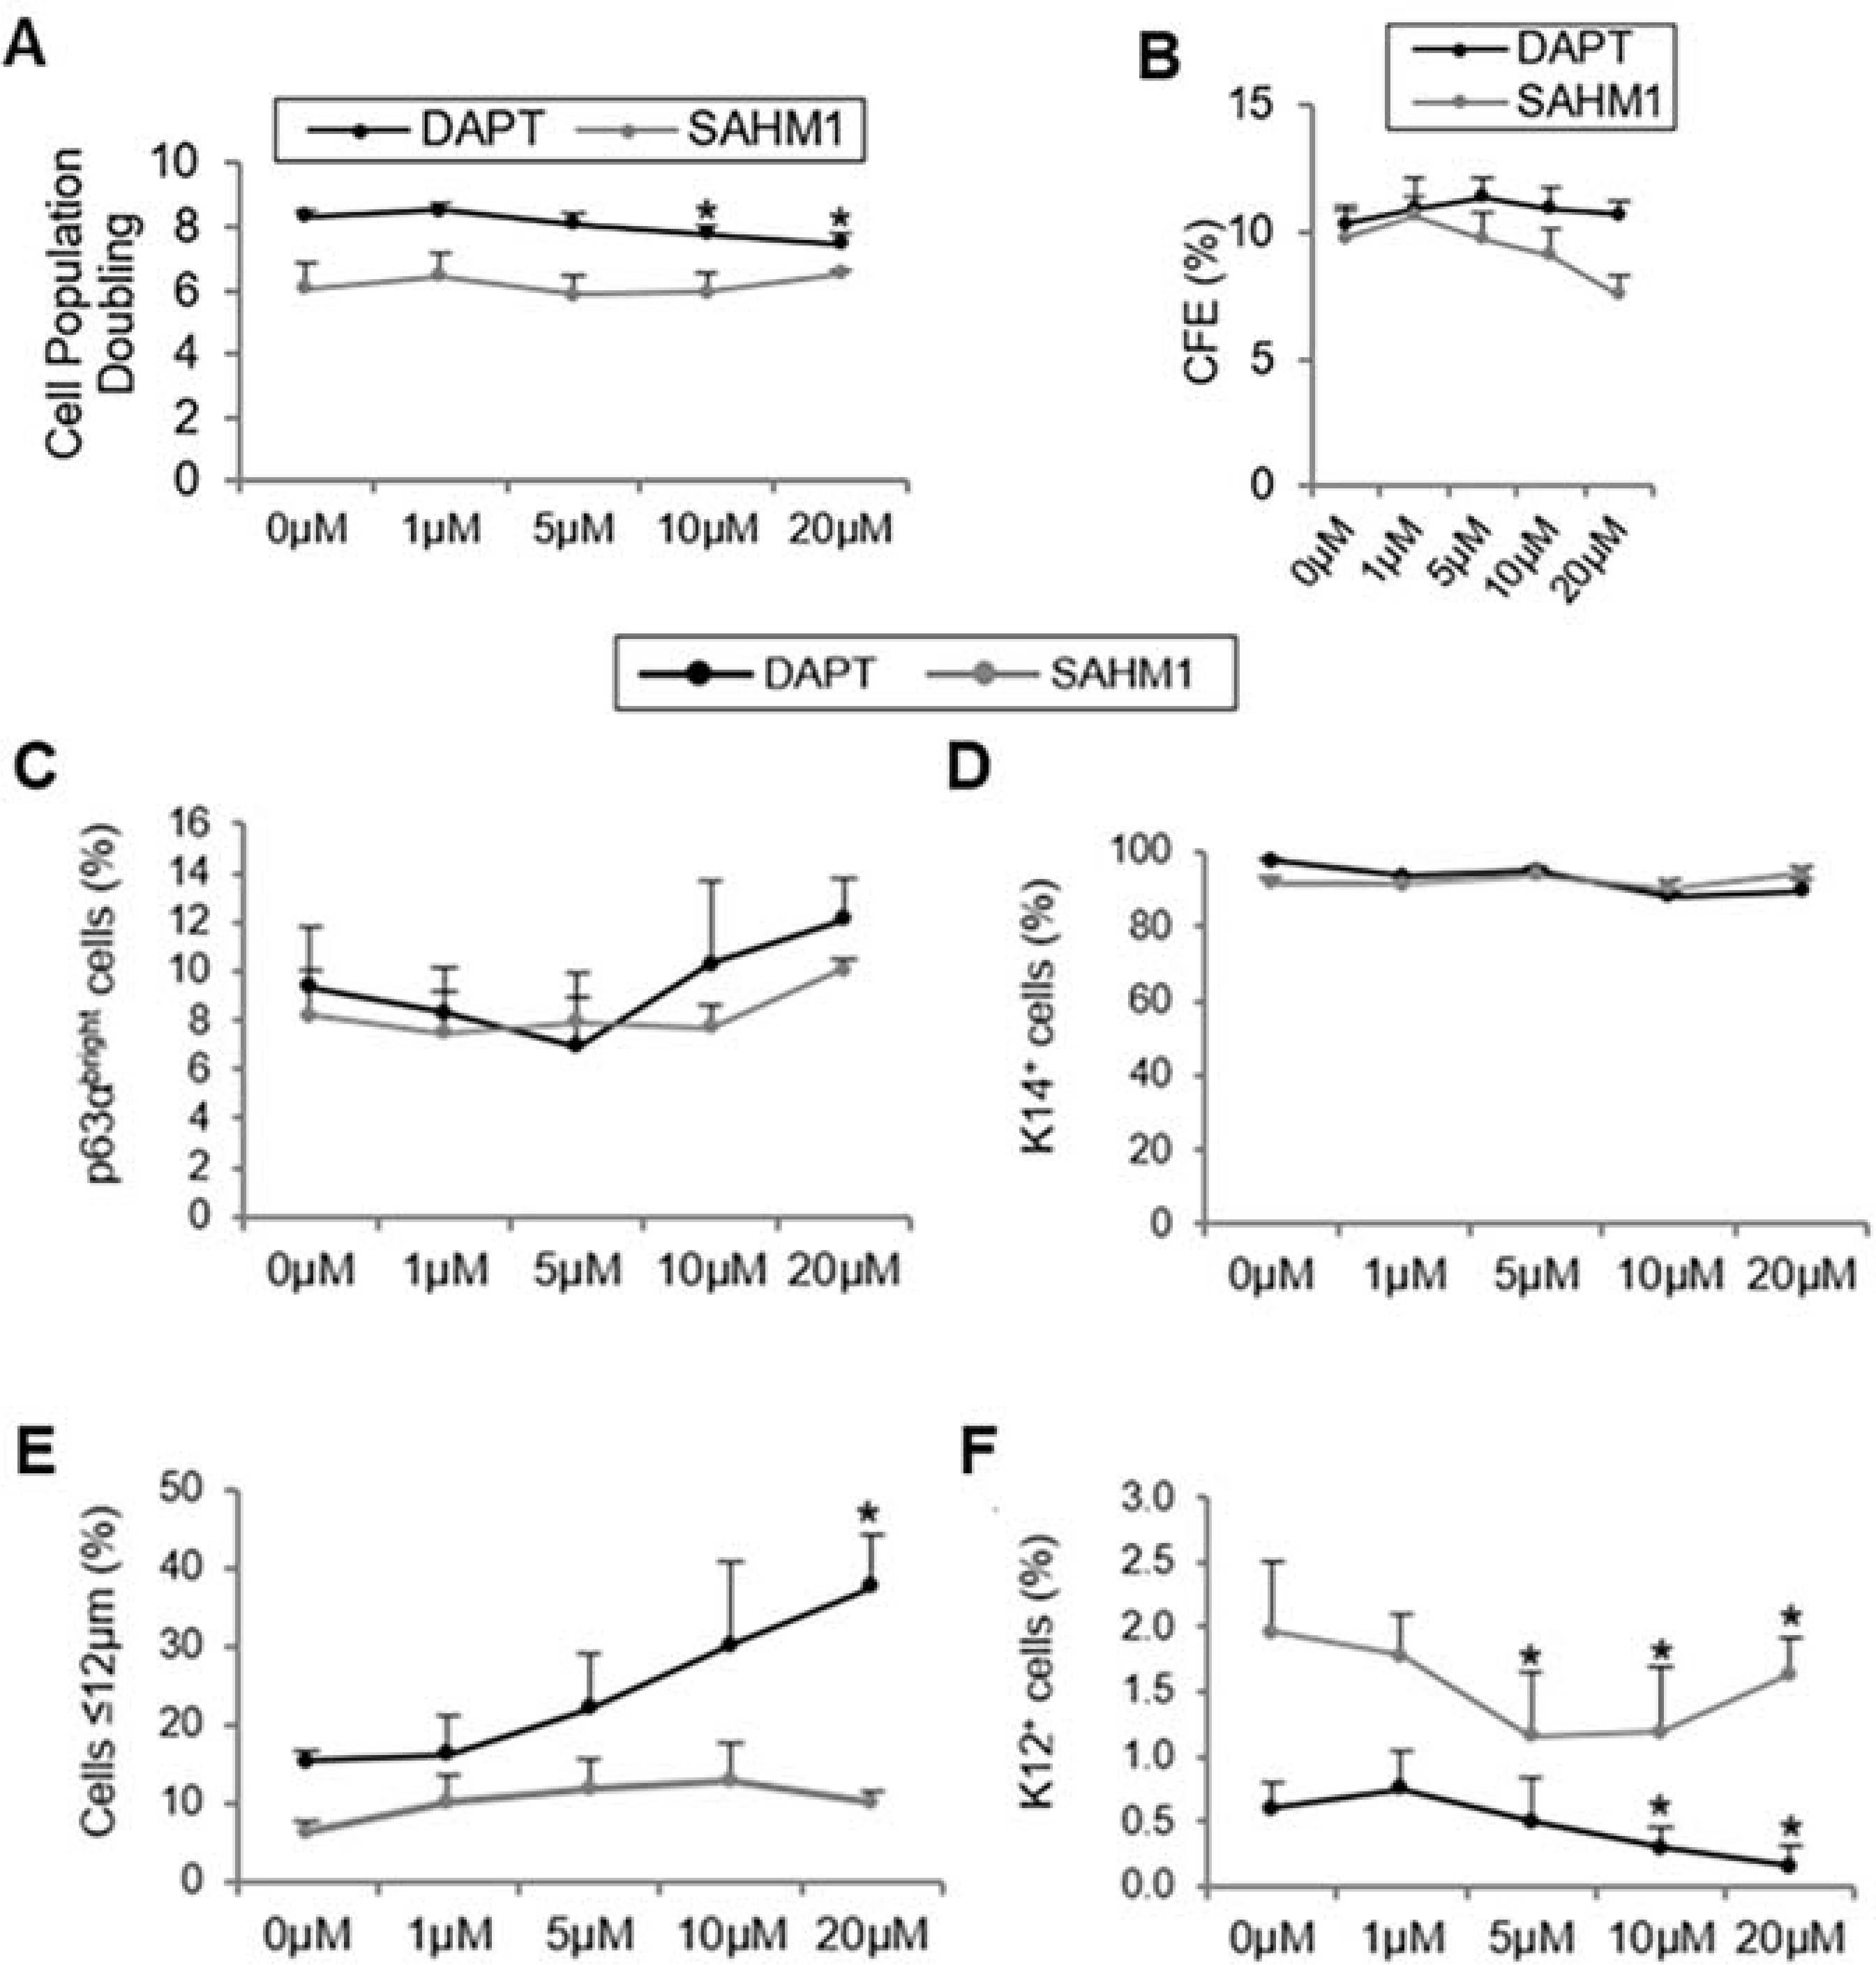
Figure 10. Inhibition of Notch signaling by DAPT and SAHM1 preserves the LSC phenotype.

A. Cell population doubling with DAPT/SAHM1. B. CFE quantification on the Rhodamine B-stained plates. C. Quantification of p63αbright cells at the protein level. D. Quantification of K14+ cells at the protein level. E. Percentage of small (≤12 μm) LSC-like cells. F. Quantification of K12+ cells at the protein level. Data are represented as mean ± SEM. *p < 0.05 were considered significant. Data are statistically analyzed by using the pairwise t-test and represented as mean ± SEM. Abbreviations: CFE: Colony Forming Efficiency; K12: cytokeratin 12; K14: cytokeratin 14; LSCs: limbal stem/progenitor cells. This figure has been adapted from a Scientific Reports article (Gonzalez et al., 2019) under a Creative Commons License. http://creativecommons.org/licenses/by/4.0/. Two figures were combined from the original article.
