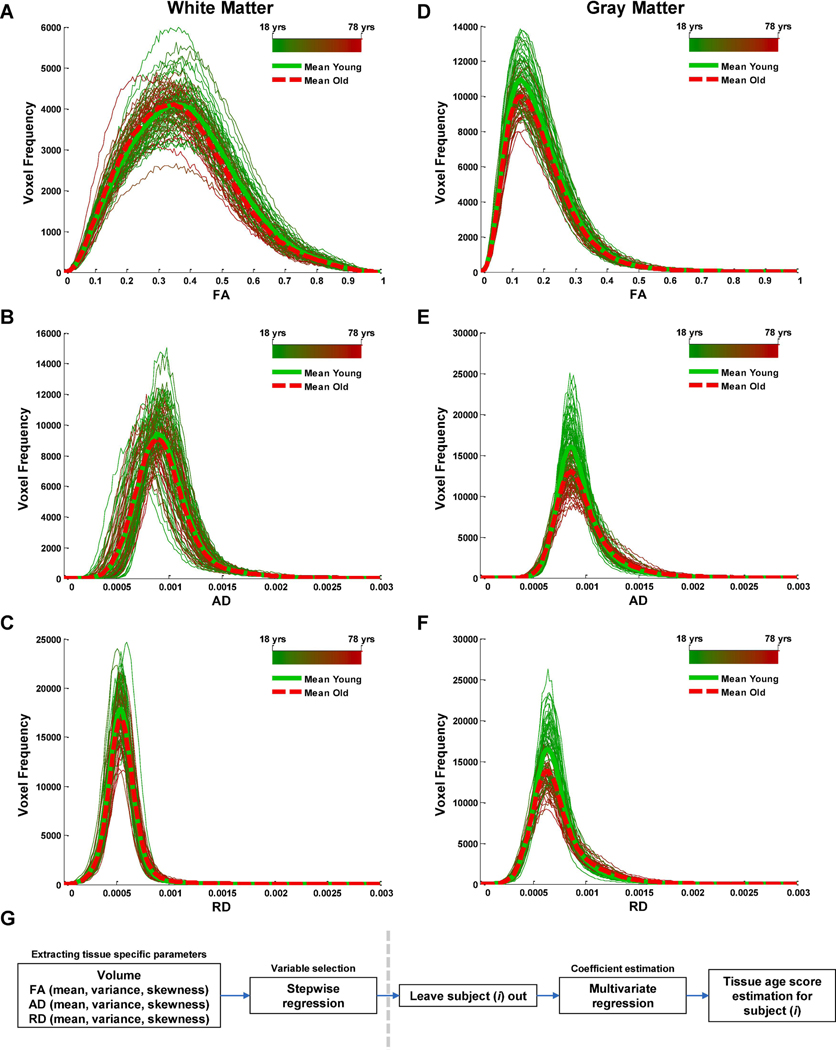
Fig. 1.
Histograms of gray matter and white matter diffusion indices. The subject-level histograms (160 bins) of voxel-wise DTI measures including fractional anisotropy (FA), axial diffusivity (AD), and radial diffusivity (RD) for white matter (A–C) and gray matter (D–F). Average histograms for younger (< 40 years old) and older (> 40 years old) participants are also shown in solid green and dashed red lines, respectively. (G) Age-score estimation procedure. Left of the dotted line. For each tissue type, volume and distribution properties of diffusivity indices were extracted, and stepwise regression was applied to select the most relevant predictors of chronological age across all participants. Right side of the dotted line. Each participant was removed from the sample and multivariate regression of chronological age on the selected predictors was applied to estimate regression coefficients. The estimates of regression coefficients were used to derive a tissue-specific age score for the removed participant. These steps (right of the dotted line) were repeated for all participants.

