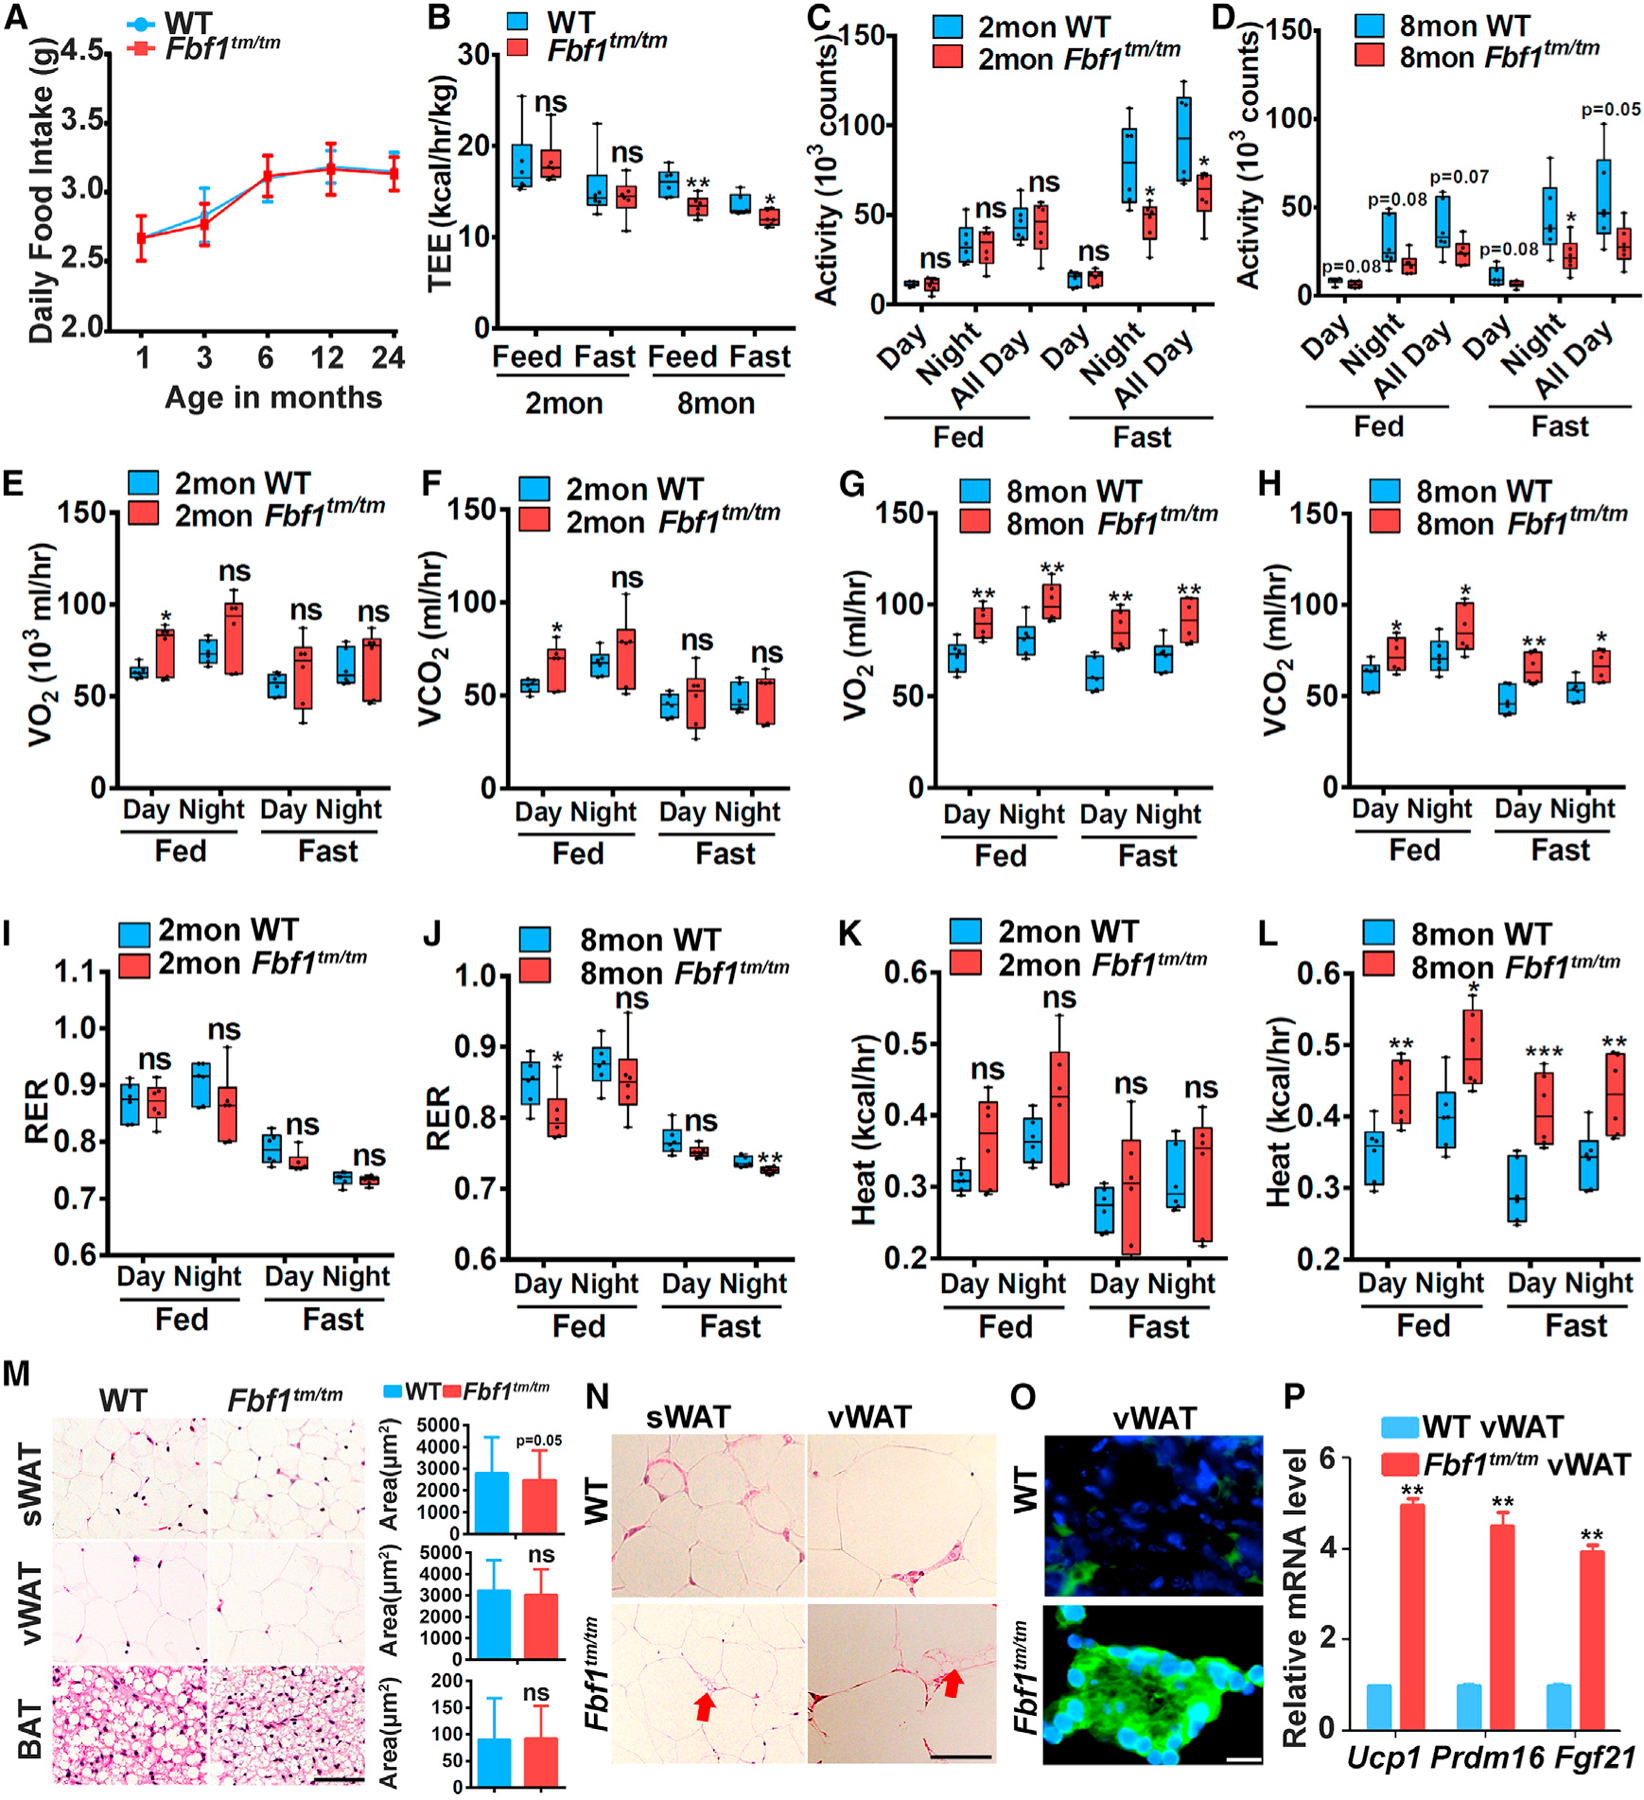
Figure 2. FBF1 depletion induces the in vivo beiging of WAT.

(A) Food intake of Fbf1tm/tm/WT littermates.
(B–L) Multiple metabolic parameters were monitored in Fbf1tm/tm/WT littermates at 2 and 8 months.
(B) Total energy expenditure was monitored by CLAMS in Fbf1tm/tm/WT littermates.
(C and D) Activity in 2- (C) and 8-month-old (D) mice.
(E and F) O2 consumption (E) and (F) CO2 production of 2-month-old mice.
(G and H) O2 consumption (F) and (H) CO2 production of 8-month-old mice.
(I–L) Average O2 consumption and CO2 production were measured by CLAMS and used to calculate RER (I and J) and heat production (K and L) in 2- and 8-month-old mice.
(M) H&E staining of WATs and BAT from 6-month-old WT/Fbf1tm/tm female mice. Scale bar, 150 µm. The adipocyte area was calculated from 200 adipocytes in each group.
(N) H&E staining of sections of WATs of Fbf1tm/tm and WT littermates. Arrow: multilocular beige adipocytes. Scale bar, 150 µm.
(O) Immunofluorescence staining of UCP1 in vWAT. Scale bar, 100 µm.
(P) Relative mRNA levels of beiging genes in vWAT.
Values are expressed as means ± SEMs, n = 8 in (A) and n = 6 in (B)–(I) in each group. p values were indicated as follows: *p < 0.05, **p < 0.01, and ***p < 0.001.
