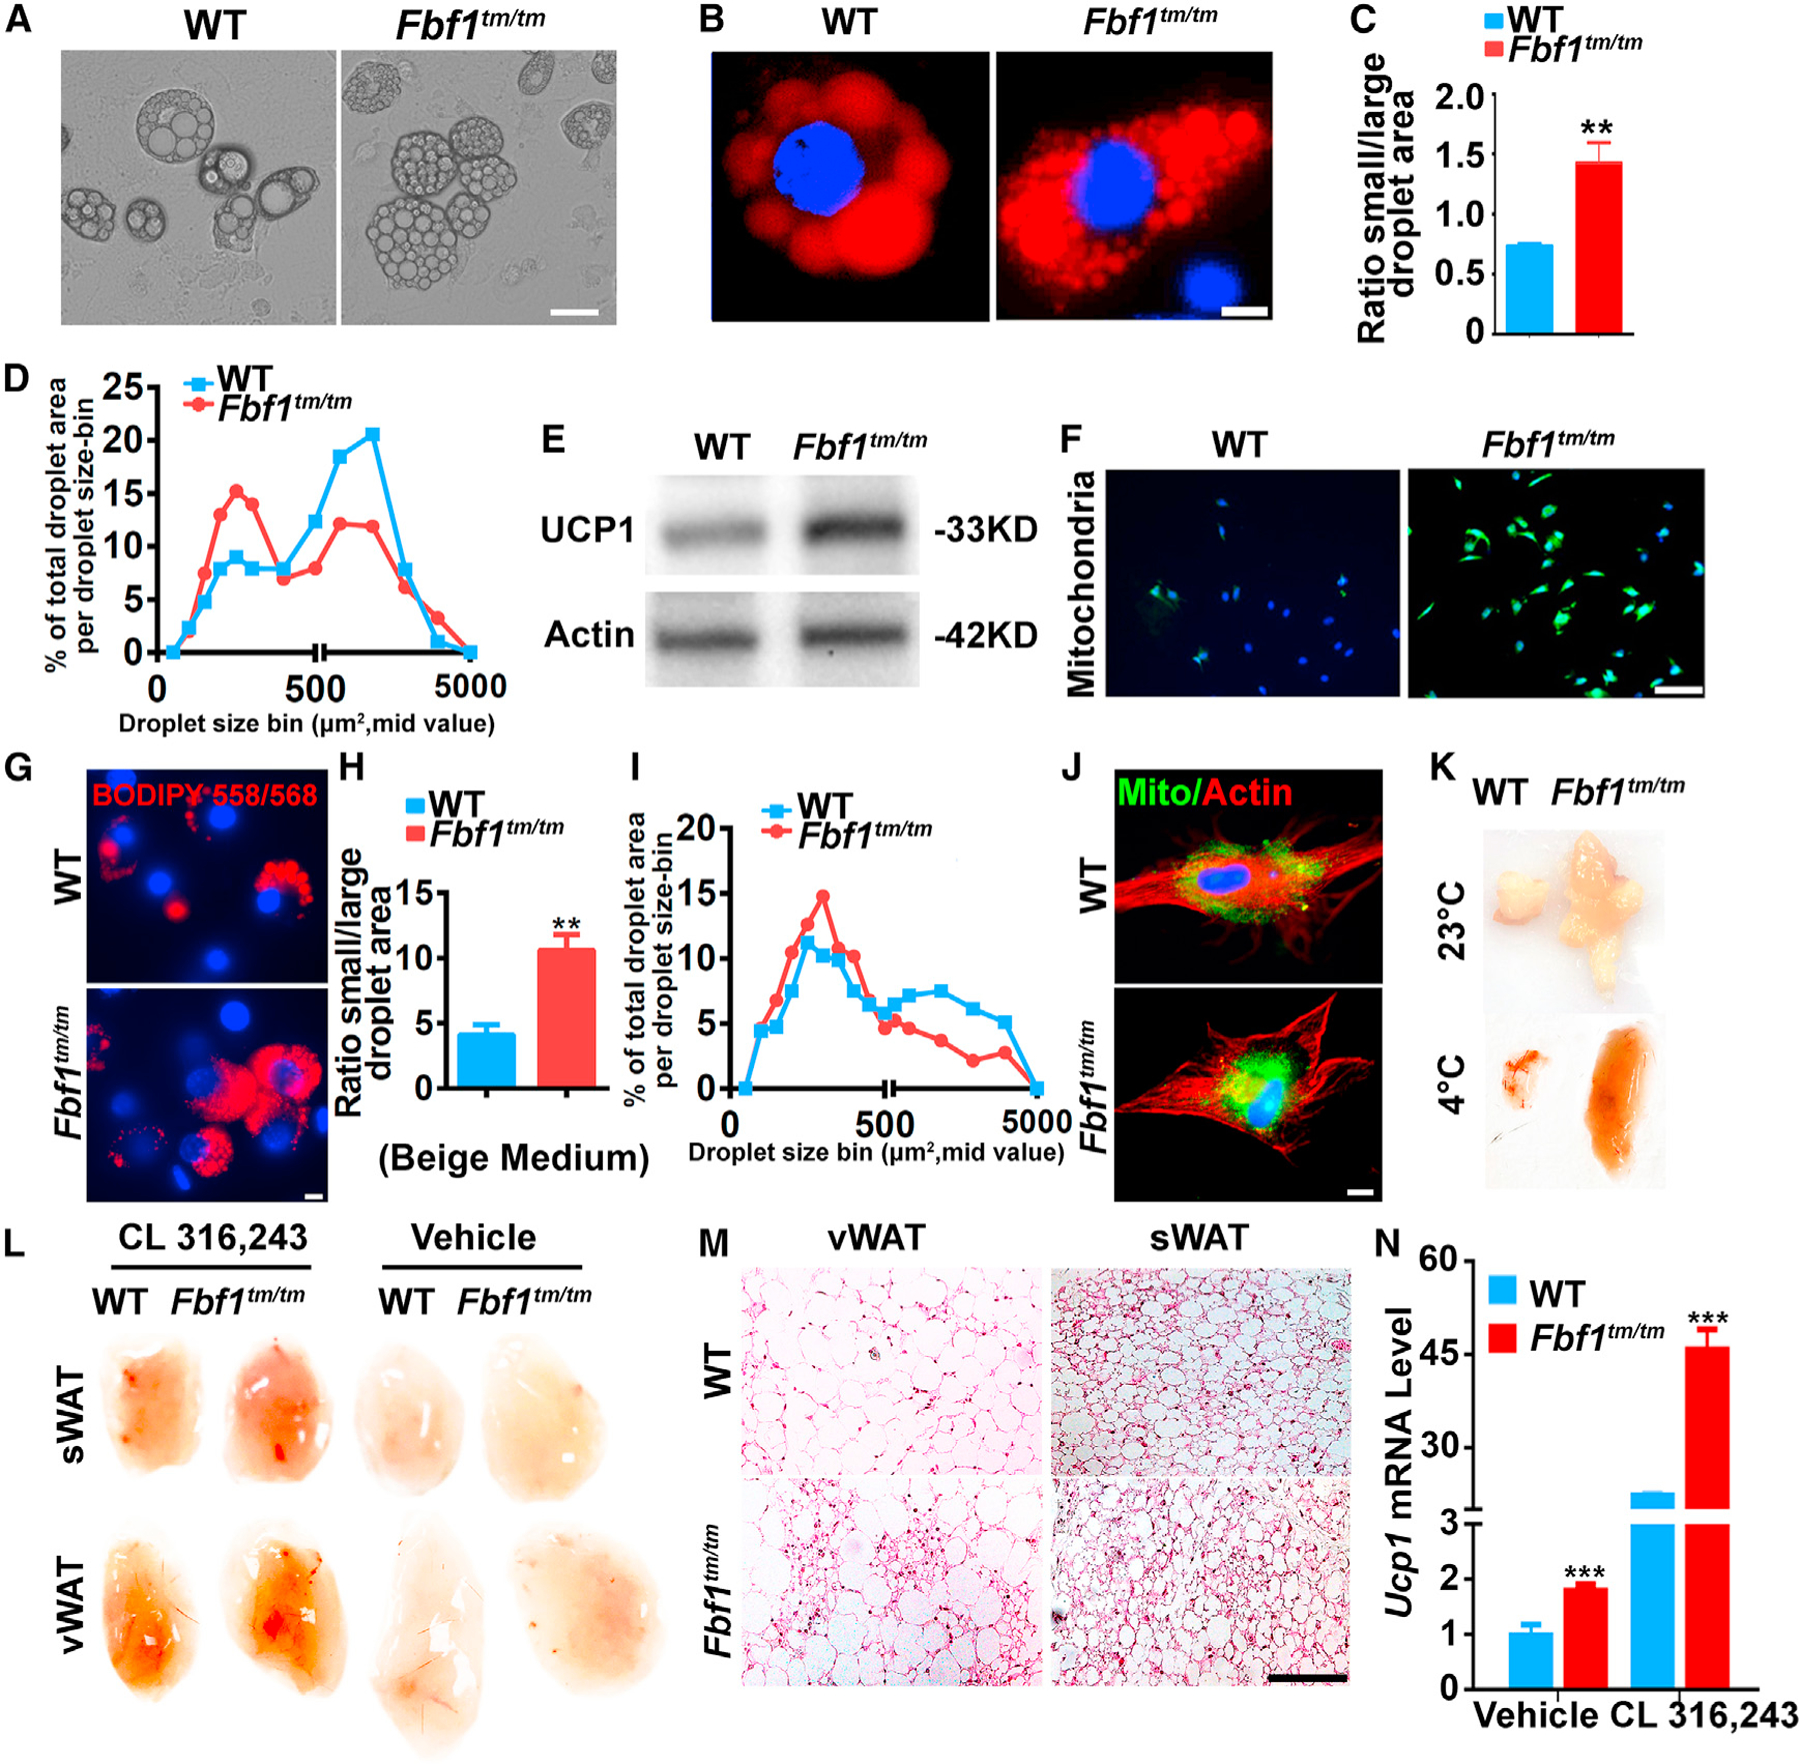
Figure 3. FBF1 level is inversely correlated with the activation of the beiging program.

(A and B) Preadipocytes isolated from vWAT and differentiated. At day 10, (A) bright-field images were taken. Scale bar, 35 µm; (B) cells were fixed, stained with BIDIPY. Red: lipids, blue: nuclei. Scale bar, 50 µm.
(C) Bar graph illustrating the quantification of a brown-like lipid index, determined by calculating the ratio of total area for small (<1,000 µm2) versus large (>1,000 µm2) lipid droplets.
(D) Quantification of changes in lipid morphology is depicted as fraction of total lipid area per lipid droplet size.
(E) Immunoblotting on UCP-1 in preadipocytes from vWAT.
(F) Preadipocytes from vWAT were cultured and differentiated for 7 days, then labeled with mitochondria-GFP. At day 8, cells were fixed, stained, and imaged by fluorescence microscopy. Green: mitochondria, blue: nuclei. Scale bar, 200 µm.
(G–J) Preadipocytes from vWAT were cultured and induced to brown-like lipid morphology.
(G) At day 7, cells were fixed, stained with BIDIPY. Red: lipids, blue: nuclei. Scale bar, 50 µm.
(H) Bar graph illustrating the quantification of a brown-like lipid index, determined by calculating the ratio of total area for small (<1,000 µm2) versus large (>1,000 µm2) lipid droplets.
(I) Quantification of changes in lipid morphology is depicted as fraction of total lipid area per lipid droplet size.
(J) Cells were fixed, stained, and imaged. Green: mitochondria, red: actin, blue: nuclei. Scale bar, 50 µm.
(K) Photograph of vWAT collected from Fbf1tm/tm/WT control exposed to 23°C or 4°C for 2 days.
(L) Photograph or WATs collected from Fbf1tm/tm/WT control treated with vehicle or CL-316,243.
(M and N) H&E staining (M) and (N) Ucp1 mRNA level of WATs collected from mice treated with vehicle or CL-316,243.
