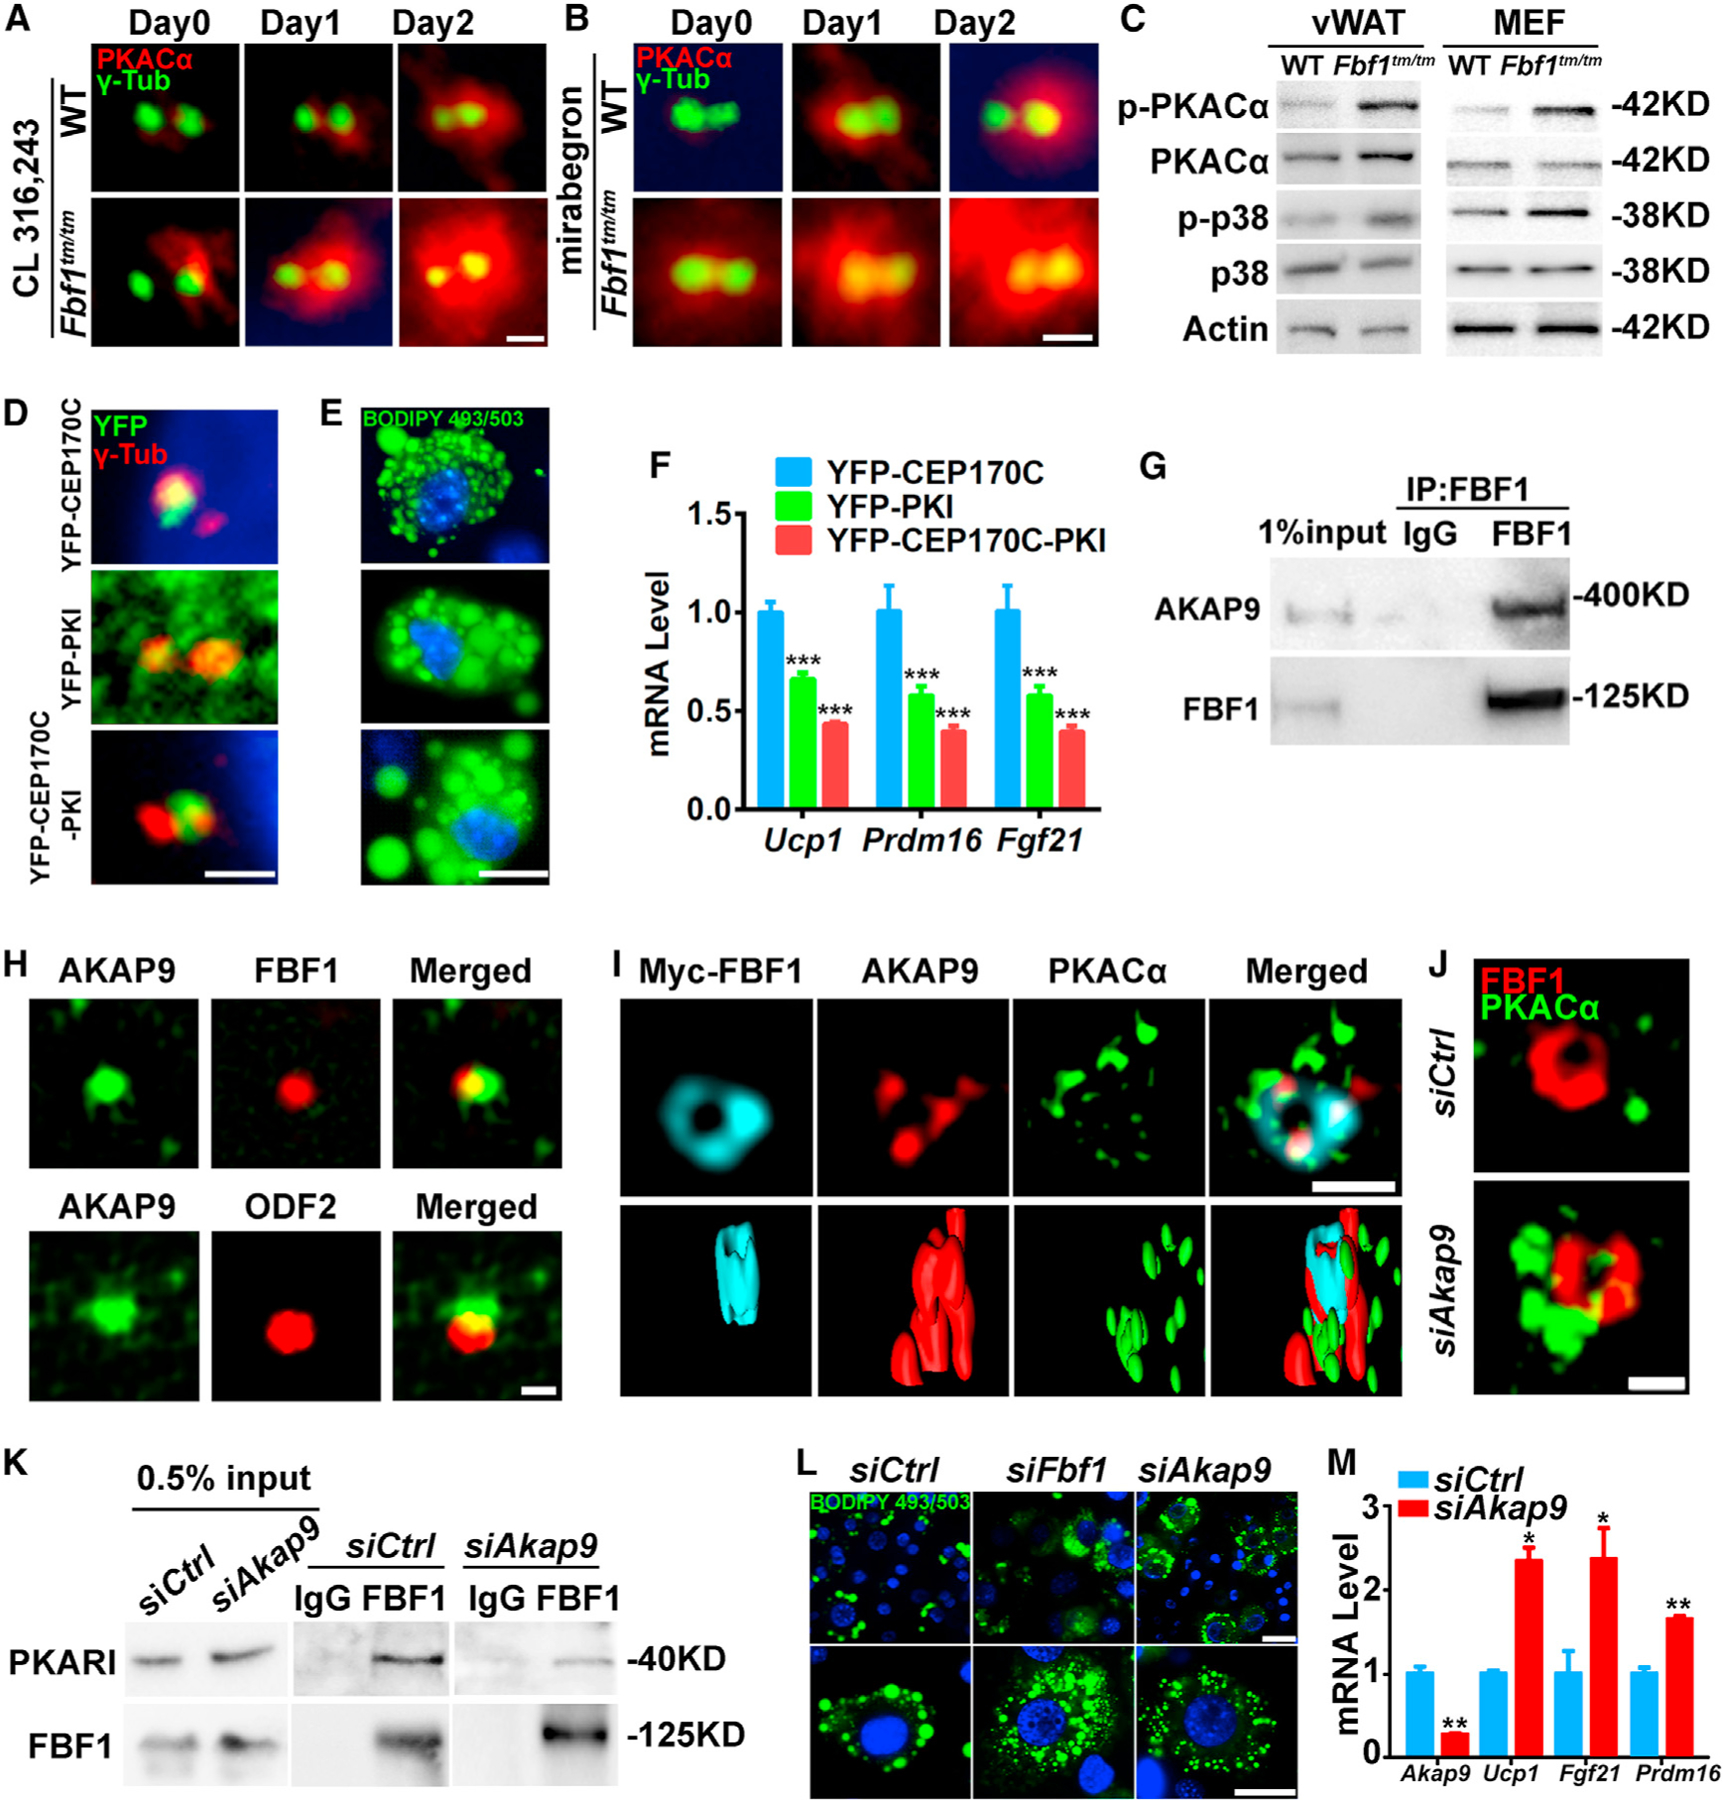
Figure 4. FBF1 controls adipose beiging through a cilia-specific PKA signaling.

(A and B) PKACα localization in WT and Fbf1tm/tm MEFs before and after treated with (A) CL-316,243 or (B) mirabegron. Centrosomes were stained with γ-tubulin. Scale bar, 1 µm.
(C) Immunoblotting on vWAT or MEF extracts.
(D) WT vWAT preadipocytes labeled with yellow fluorescent protein (YFP)-tagged CEP170C-PKI, CEP170C, and PKI. Centrosomes were stained with γ-tubulin. Scale bar, 1 µm.
(E) WT vWAT preadipocytes overexpressed PKI, CEP170C, or CEP170C-PKI were treated with CL-316,243 and differentiated for 7 days in adipogenic medium (AM), then fixed, stained, and imaged. Green: lipids, blue: nuclei. Scale bar, 50 µm.
(F) Relative mRNA levels of beiging genes in WT vWAT preadipocytes overexpressed PKI, CEP170C, or CEP170C-PKI.
(G) Endogenous AKAP9 immunoprecipitates with FBF1 in 3T3-L1 cells.
(H) AKAP9 localization in 3T3-L1 cells. FBF1 or ODF2 labeled basal bodies. Scale bar, 1 µm.
(I) SIMS and 3-dimensional (3D) surface-rendering images of the basal bodies of 3T3-L1 cells stained for PKACα, AKAP9, and FBF1. Scale bar, 1 µm.
(J) SIMS images of the basal bodies of 3T3-L1 cells stained for PKACα and FBF1. Scale bar, 1 µm.
(K) Association between endogenous PKARI and FBF1 in 3T3-L1 cells treated with control or Akap9 siRNA.
(L) 3T3-L1 cells treated with control or Akap9 siRNA were differentiated with CL-316,243 inductions for 7 days, then fixed, stained, and imaged. Green: lipids, blue: nuclei. Scale bar, 100 µm.
(M) Relative mRNA levels of beiging genes in 3T3-L1 cells treated with control or Akap9 siRNA.
