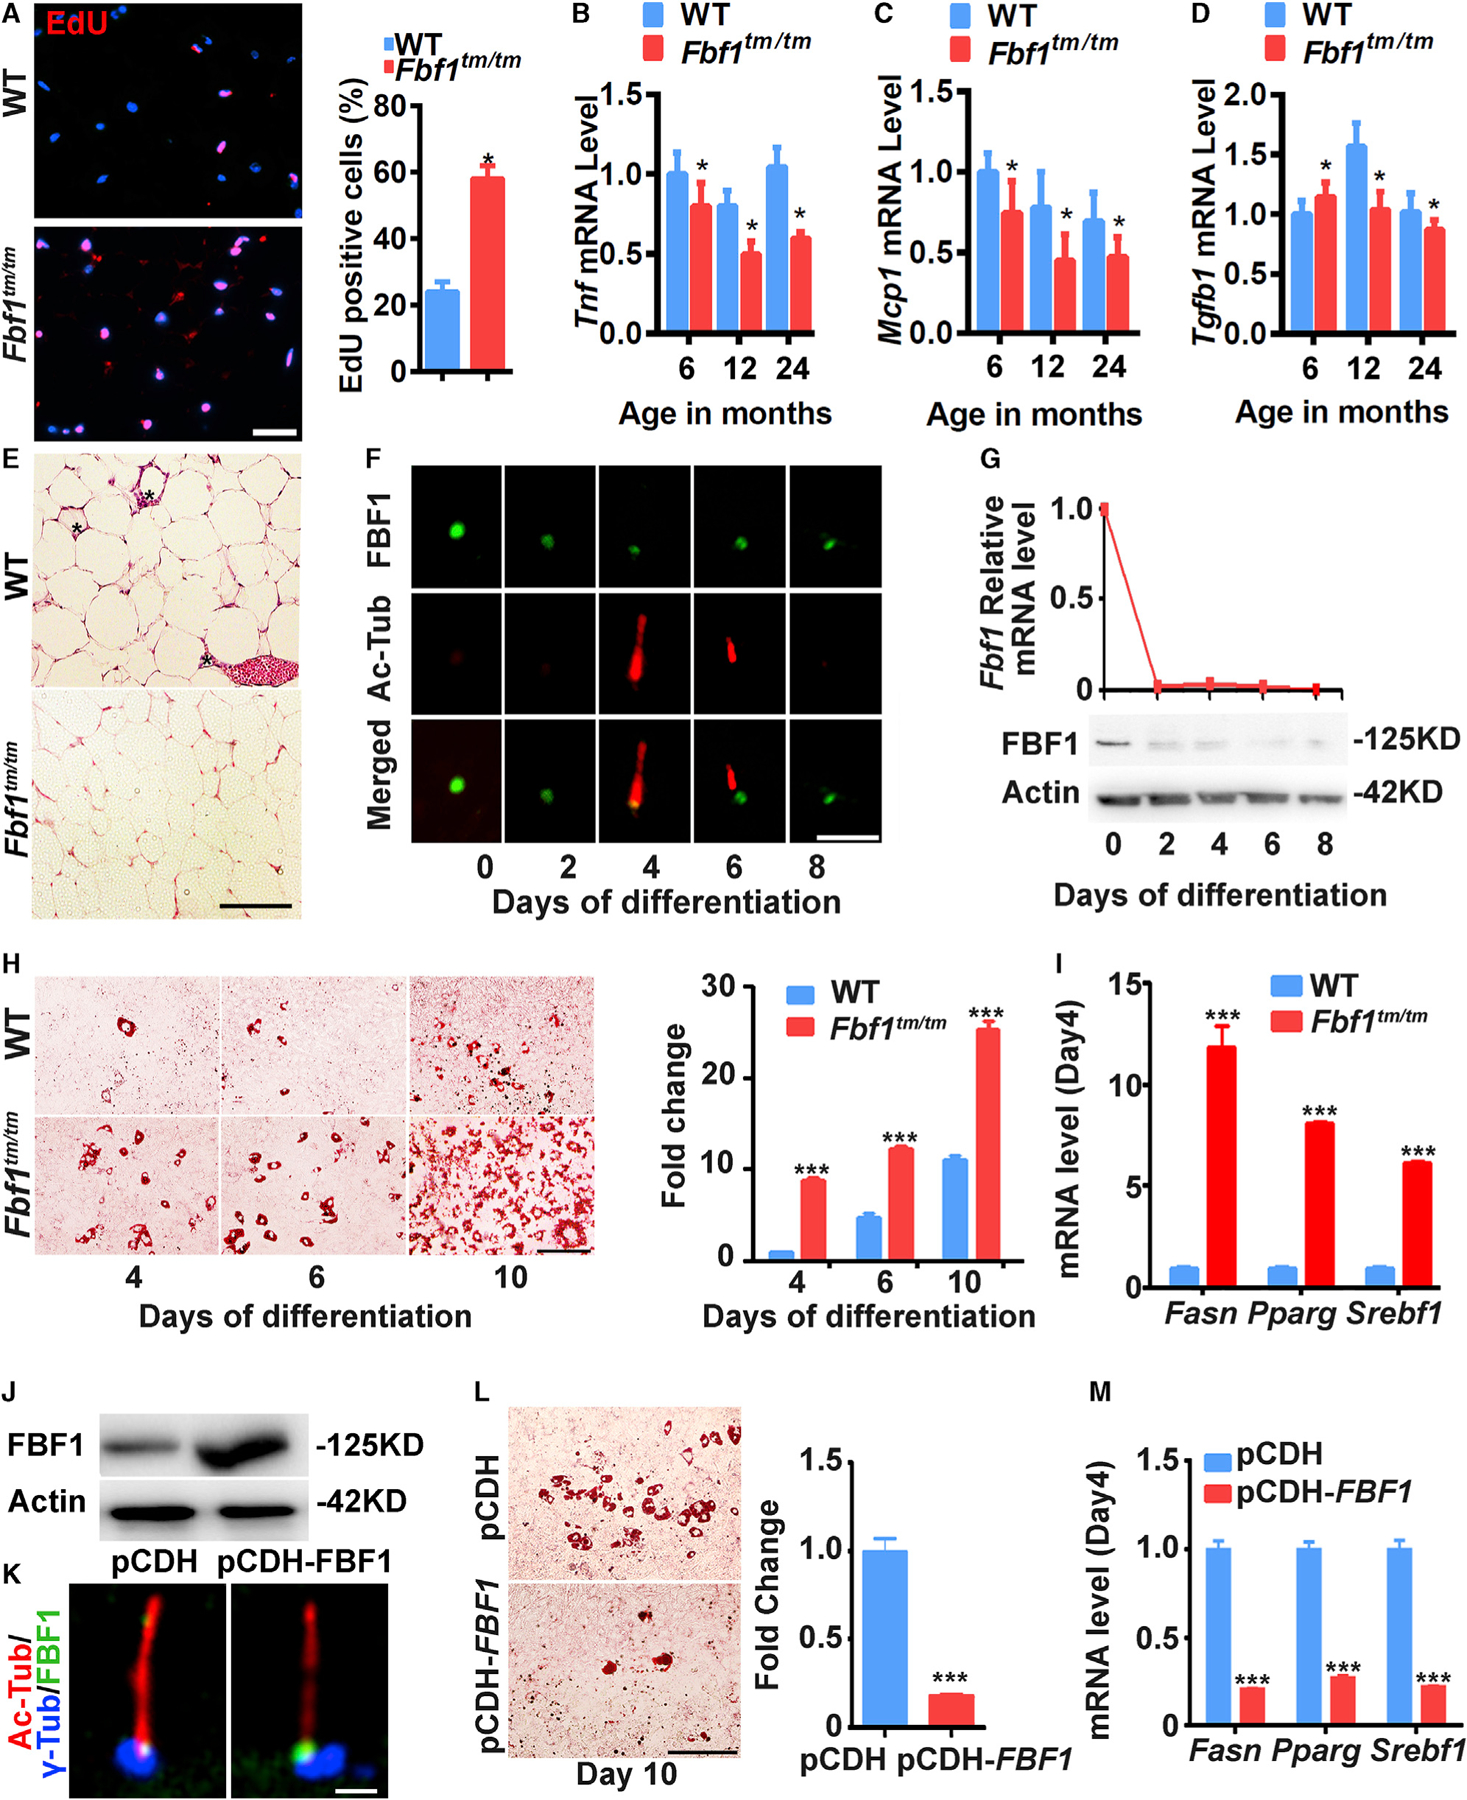
Figure 5. FBF1 deficiency enhances adipogenic differentiation.

(A) Fluorescence images were obtained by the EdU incorporation assay for vWAT from 6-month-old female WT/Fbf1tm/tm mice. Red: EdU+ cells, blue: nuclei. Scale bar, 100 µm. Data were calculated from 300 cells in each group.
(B–D) Inflammatory genes expression levels of vWAT in different ages.
(E) H&E staining of sections of WATs of Fbf1tm/tm and WT littermates at 18 months. Macrophages surrounding adipocyte (asterisk). Scale bar, 200 µm.
(F and G) Immunofluorescence images of cilia (Ac-tubulin, red) and FBF1 staining during adipogenic differentiation (F) and (G) relative mRNA and protein levels of FBF1 of WT MEFs. Scale bars, 5 µm.
(H) WT/Fbf1tm/tm MEFs were induced to differentiate for 4, 6, and 8 days, then stained with oil red O. Images are representative of n = 6 replicates. Scale bar, 150 µm.
(I) Relative mRNA levels of adipogenic markers at day 4 of differentiation of MEFs.
(J) Protein levels of FBF1 in 3T3-L1 cells overexpressed with plasmid pCDH vector or pCDH-FBF1.
(K) Immunofluorescence assays in 3T3-L1 cells using antibodies against FBF1. Basal bodies and cilia were labeled with anti-γ-tubulin and anti-acetylated tubulin. Scale bar, 5 µm.
(L) 3T3-L1 cells were overexpressed with pCDH vehicle or pCDH-FBF1, differentiated for 10 days, and stained with oil red O. Scale bar, 150 µm.
(M) Relative mRNA levels of adipogenic markers at day 4 of differentiation of 3T3-L1 cells overexpressed vehicle or FBF1.
Values are expressed as means ± SEMs, n = 6 in (A)–(E) in each group. p values were indicated in figures as follows: *p < 0.05, **p < 0.01, and ***p < 0.001.
