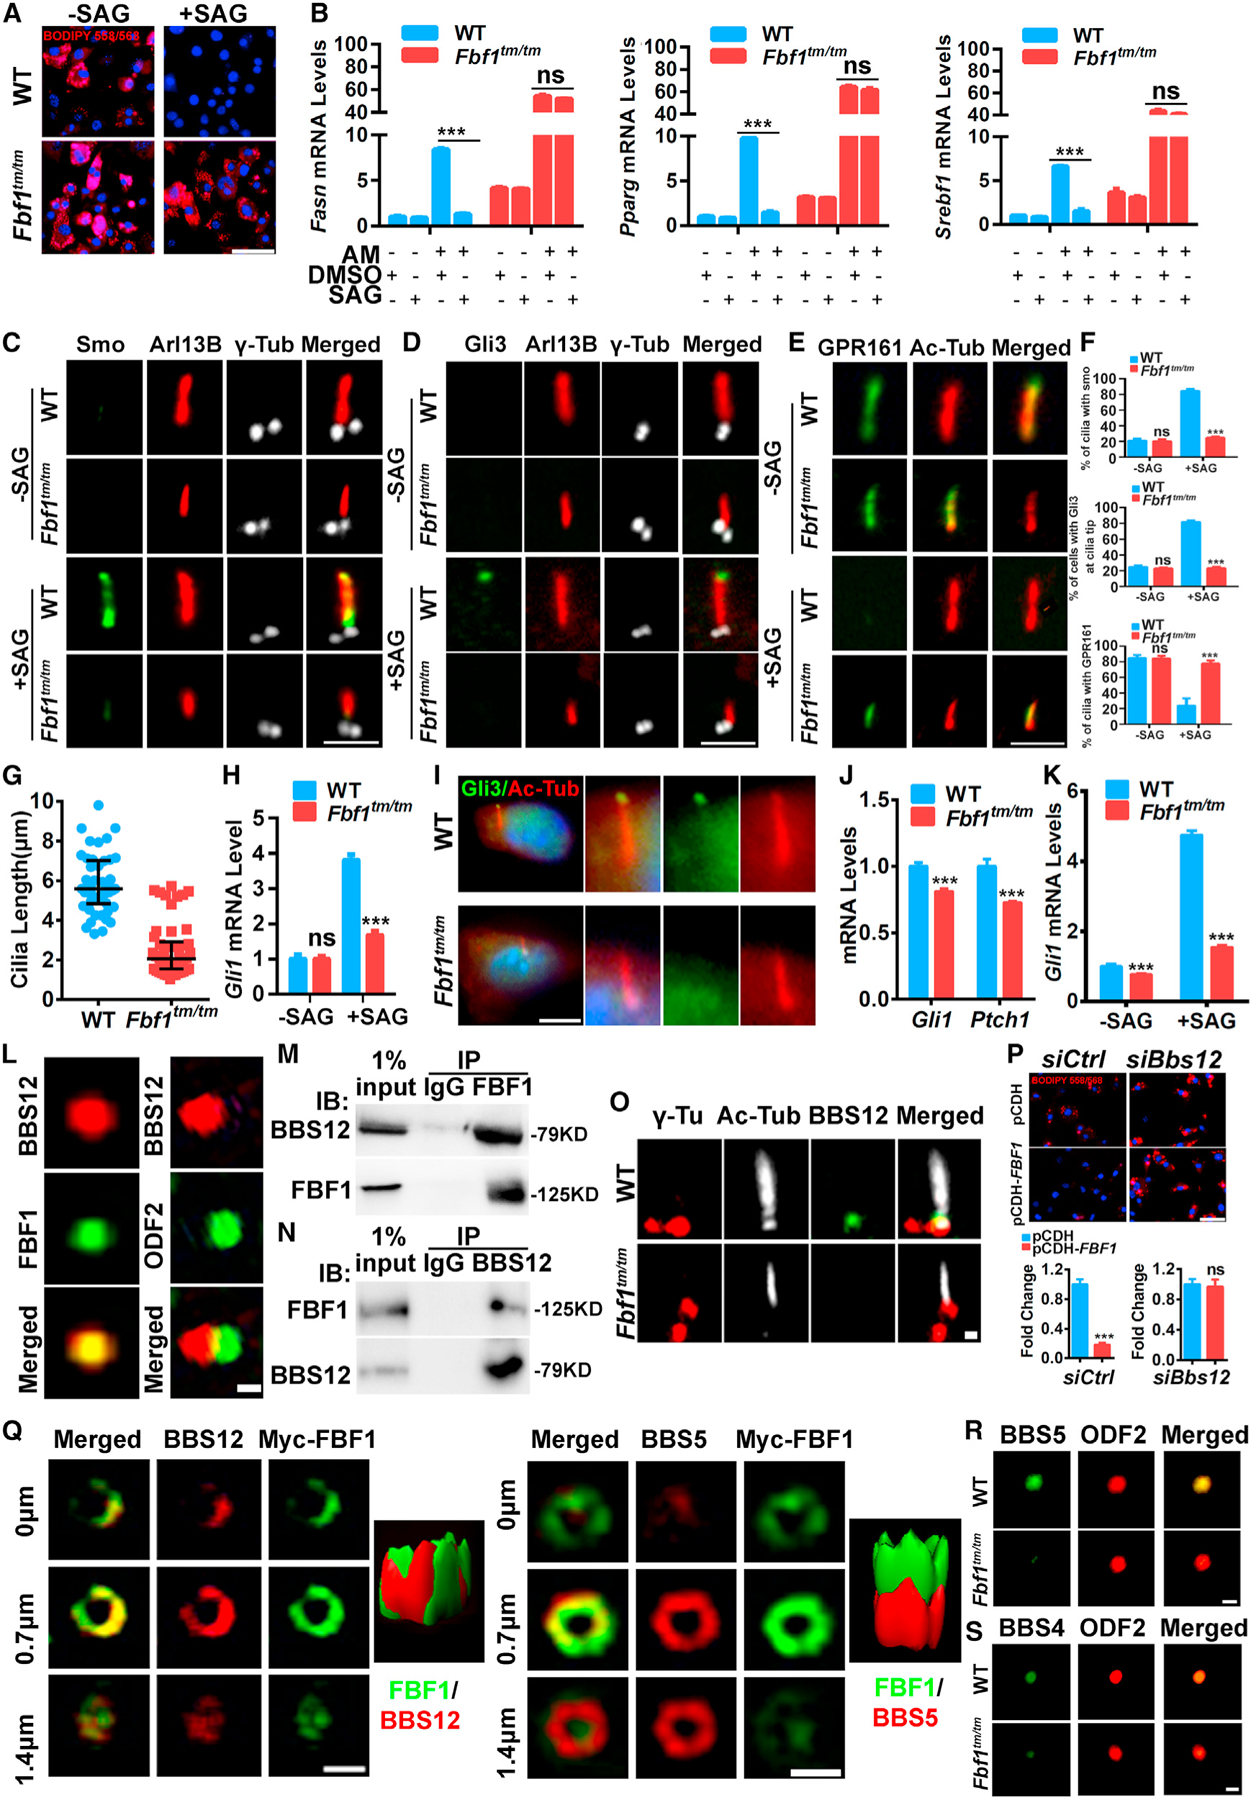
Figure 6. FBF1 controls Hh signaling by recruiting BBS chaperone complex to TFs.

(A) WT/Fbf1tm/tm MEFs were treated with DMSO or SAG and differentiated for 7 days, then fixed and stained with BIDIPY. Red: lipids, blue: nuclei. Scale bar, 150 µm.
(B) Relative mRNA levels of adipogenic genes at day 4 of differentiation with or without AM in WT/Fbf1tm/tm MEFs treated with DMSO or SAG.
(C–E) Localization of Smo (C), (D) Gli3, and (E) GPR161 in primary cilia of WT/Fbf1tm/tm MEFs treated with DMSO or SAG. Basal bodies and cilia were labeled with anti-γ-tubulin and anti-acetylated tubulin. Scale bar, 5 µm.
(F) Statistical analysis of Smo+, Gli3+, and GPR161+ cilia. Data were calculated from 300 cilia in each group. Values are expressed as means ± SEMs. ***p < 0.001.
(G) Cilia length of WT and Fbf1tm/tm MEFs.
(H) Gli1 mRNA level in WT and Fbf1tm/tm MEFs before and after Hh activation.
(I) Localization of GLI3 in primary cilia of WT/Fbf1tm/tm vWAT tissues. Basal bodies and cilia were labeled with anti-γ-tubulin and anti-acetylated tubulin. Scale bar, 5 µm.
(J) Gli1 and Ptch1 mRNA levels in WT and Fbf1tm/tm vWAT tissues.
(K) Gli1 mRNA level in WT and Fbf1tm/tm vWAT preadipocytes before and after Hh activation.
(L) WT MEFs labeled with BBS12 and TF marker FBF1 or subdistal appendage marker ODF2, and analyzed with SIMS. Scale bar, 1 µm.
(M) Endogenous BBS12 immunoprecipitates with FBF1 in 3T3-L1 cells.
(N) Endogenous FBF1 immunoprecipitates with BBS12 in 3T3-L1 cells.
(O) The localization of BBS12 in WT/Fbf1tm/tm MEFs. Anti-γ-tubulin and anti-acetylated tubulin-labeled basal bodies and cilia. Scale bar, 5 µm.
(P) Control or Bbs12-knockdown 3T3-L1 cells were overexpressed vehicle or FBF1 and differentiated for 7 days, then fixed, stained, and imaged. Red: lipids, blue: nuclei. Scale bar, 150 µm.
(Q) SIM and 3D surface-rendering images of 3T3-L1 cells. Scale bar, 1 µm.
(R) BBSome component BBS5 localization in WT/Fbf1tm/tm MEFs. Basal bodies were stained with ODF2. Scale bar, 1 µm.
(S) BBSome component BBS4 localization in WT/Fbf1tm/tm MEFs. Basal bodies were stained with ODF2. Scale bar, 1 µm.
