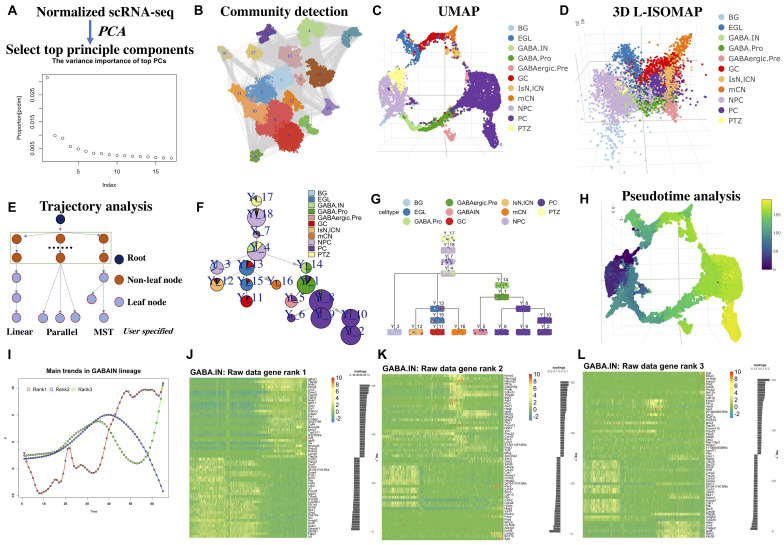
FIGURE 1.
Workflow of LISA2 and cerebellum trajectory analysis. (A) PCA and principal component selection. (B) Community detection for clustering based on k-nearest neighbors (kNN) graph. (C) Visualizing in UMAP and (D) 3D L-ISOMAP. (E) Trajectory building in LISA2 by specifying root and leaf node structure [linear, parallel, and minimum spanning tree (MST)]. (F) Trajectory visualization by pie tree plot. (G) Trajectory visualization by cell cluster tree plot (each box is a cluster marked by Y_cluster ID, each point represents a cell). (H) Pseudotime visualization. (I) Gene expression trend analysis by principal trend analysis (PTA) in GABA.IN branch. PTA was applied to the GABA.IN branch to identify main gene expression trends (red, blue, and green) from rank 1 to rank 3. (J–L) Heatmap shows gene expression trend of the GABA.IN branch discovered by PTA in ranks 1, 2, and 3. The root cell type PTZ is in yellow in UMAP and 3D-ISOMAP. The leaf cells are divided into three branches. GCs, mCN, and IsN/lCN are derived from EGL. PC is derived from GABAergic.Pre. BG is derived from NPC. We chose linear structure for BG; parallel structure for GC, mCN, and IsN/lCN; tree structure for PC cells. BG, Bergmann glia; EGL, external granule layer cells; GABA.pro, GABAergic progenitor; GABA.pre, GABAergic precursors; GABA.IN, GABAergic interneurons; IsN, isthmic nuclear neuron; mCN, medial cerebellar nuclei; lCN, lateral cerebellar nuclei; NPC, neural progenitor cell; GC, granule cell; MidO, midline organizer cell; PC, Purkinje cell; PTZ, posterior transitory zone.

