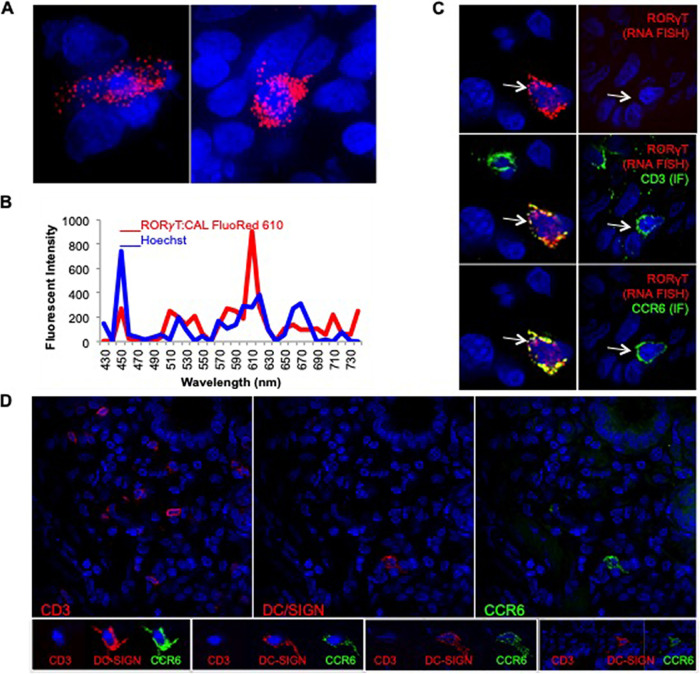
FIG 6.
The majority of CCR6+ CD3+ T cells express RORγT in the anorectal tissue. RM anorectal tissue was processed for RORγT FISH (red) and/or IF for CD3 and CCR6 (green). Hoechst nuclear stain is shown in blue. (A) RORγT FISH. (B) Spectral imaging of one of the RORγT+ cells in panel A. Cal Fluor Red 610-labeled RORγT (red, 610 nm) and Hoechst stain (blue, 460 nm). (C) Sequential IF and FISH; CD3+ CCR6+ cells that are RORγT+ (left panels, arrows) or RORγT− (right panels, arrows). (D) All CCR6+ CD3− cells express DC-SIGN molecule CD209 in the anorectal tissue. Cryosections were immunolabeled with CD3, CD209 (DC-SIGN), and CCR6 antibodies and Hoechst stain. Each row shows images of the same field. The top panel is a low-magnification (×40) view to depict the distribution of T cells and iDCs throughout the tissue, while bottom row is a closeup to show distinct morphology of iDCs (larger size with multiple dendrite projections) versus T cells (small granular in appearance).

