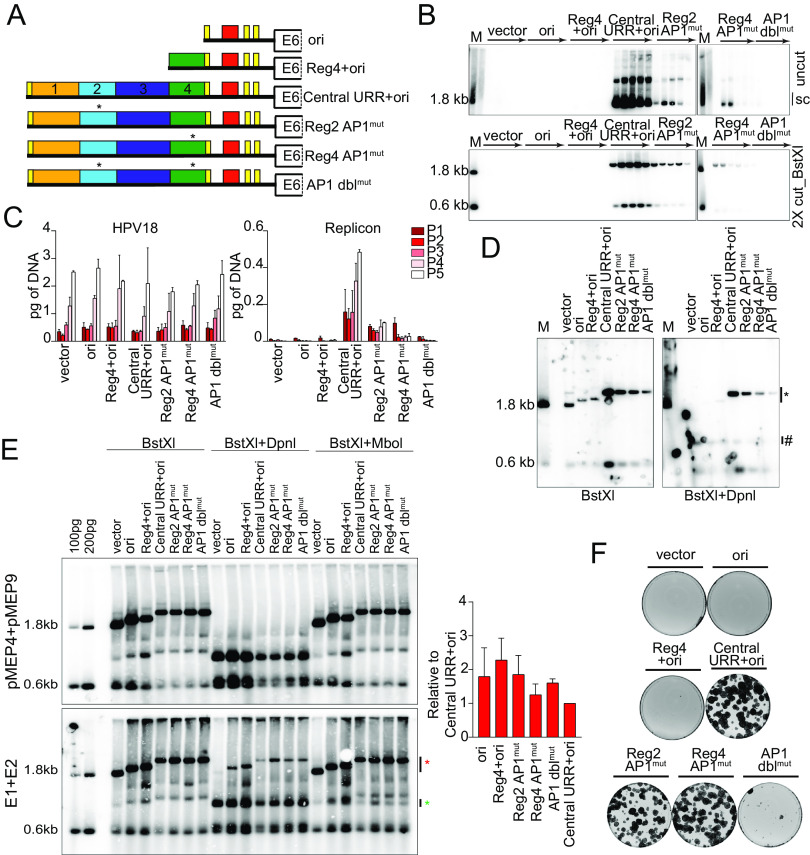
FIG 9.
Mutation of AP1 binding sites impacts replicon replication. (A) Diagram of AP1 mutations present in replicons. (B) DNA collected from five passages of cotransfected cells were analyzed by Southern blotting as described in Fig. 2C. (C) HPV18 genome (left) and replicon (right) copy numbers were measured by qPCR. (D) DNA was collected from keratinocytes cotransfected with HPV18 and the indicated test replicon 48 h after transfection and analyzed by Southern blotting as described in Fig. 5D. (E) Keratinocytes were cotransfected with the indicated replicons and either empty pMEP vector control plasmids or pMEP E1 and E2 expression plasmids. E1 and E2 expression was induced with CdSO4 24 h posttransfection for 5 h. Low-molecular-weight DNA was extracted 48 h posttransfection and analyzed by Southern blotting as described in Fig. 5D with an additional restriction digest that specifically digests replicating DNA (MboI). MboI-sensitive and DpnI-resistant bands are indicated by green and red asterisks, respectively. DpnI-resistant DNA was quantified by phosphorimaging analysis of three independent experiments. Values shown in the graph are relative to the control central URR+ori replicon. (F) Keratinocyte colonies arising from continuous G418 selection were stained with methylene blue approximately 14 days posttransfection. Error bars represent the standard deviation. The data shown are representative (panels B and E) or an average (panel C) of two biological replicates. The data shown for transient replication are representative of one (panel D) of three (panel E) bioreplicates.

