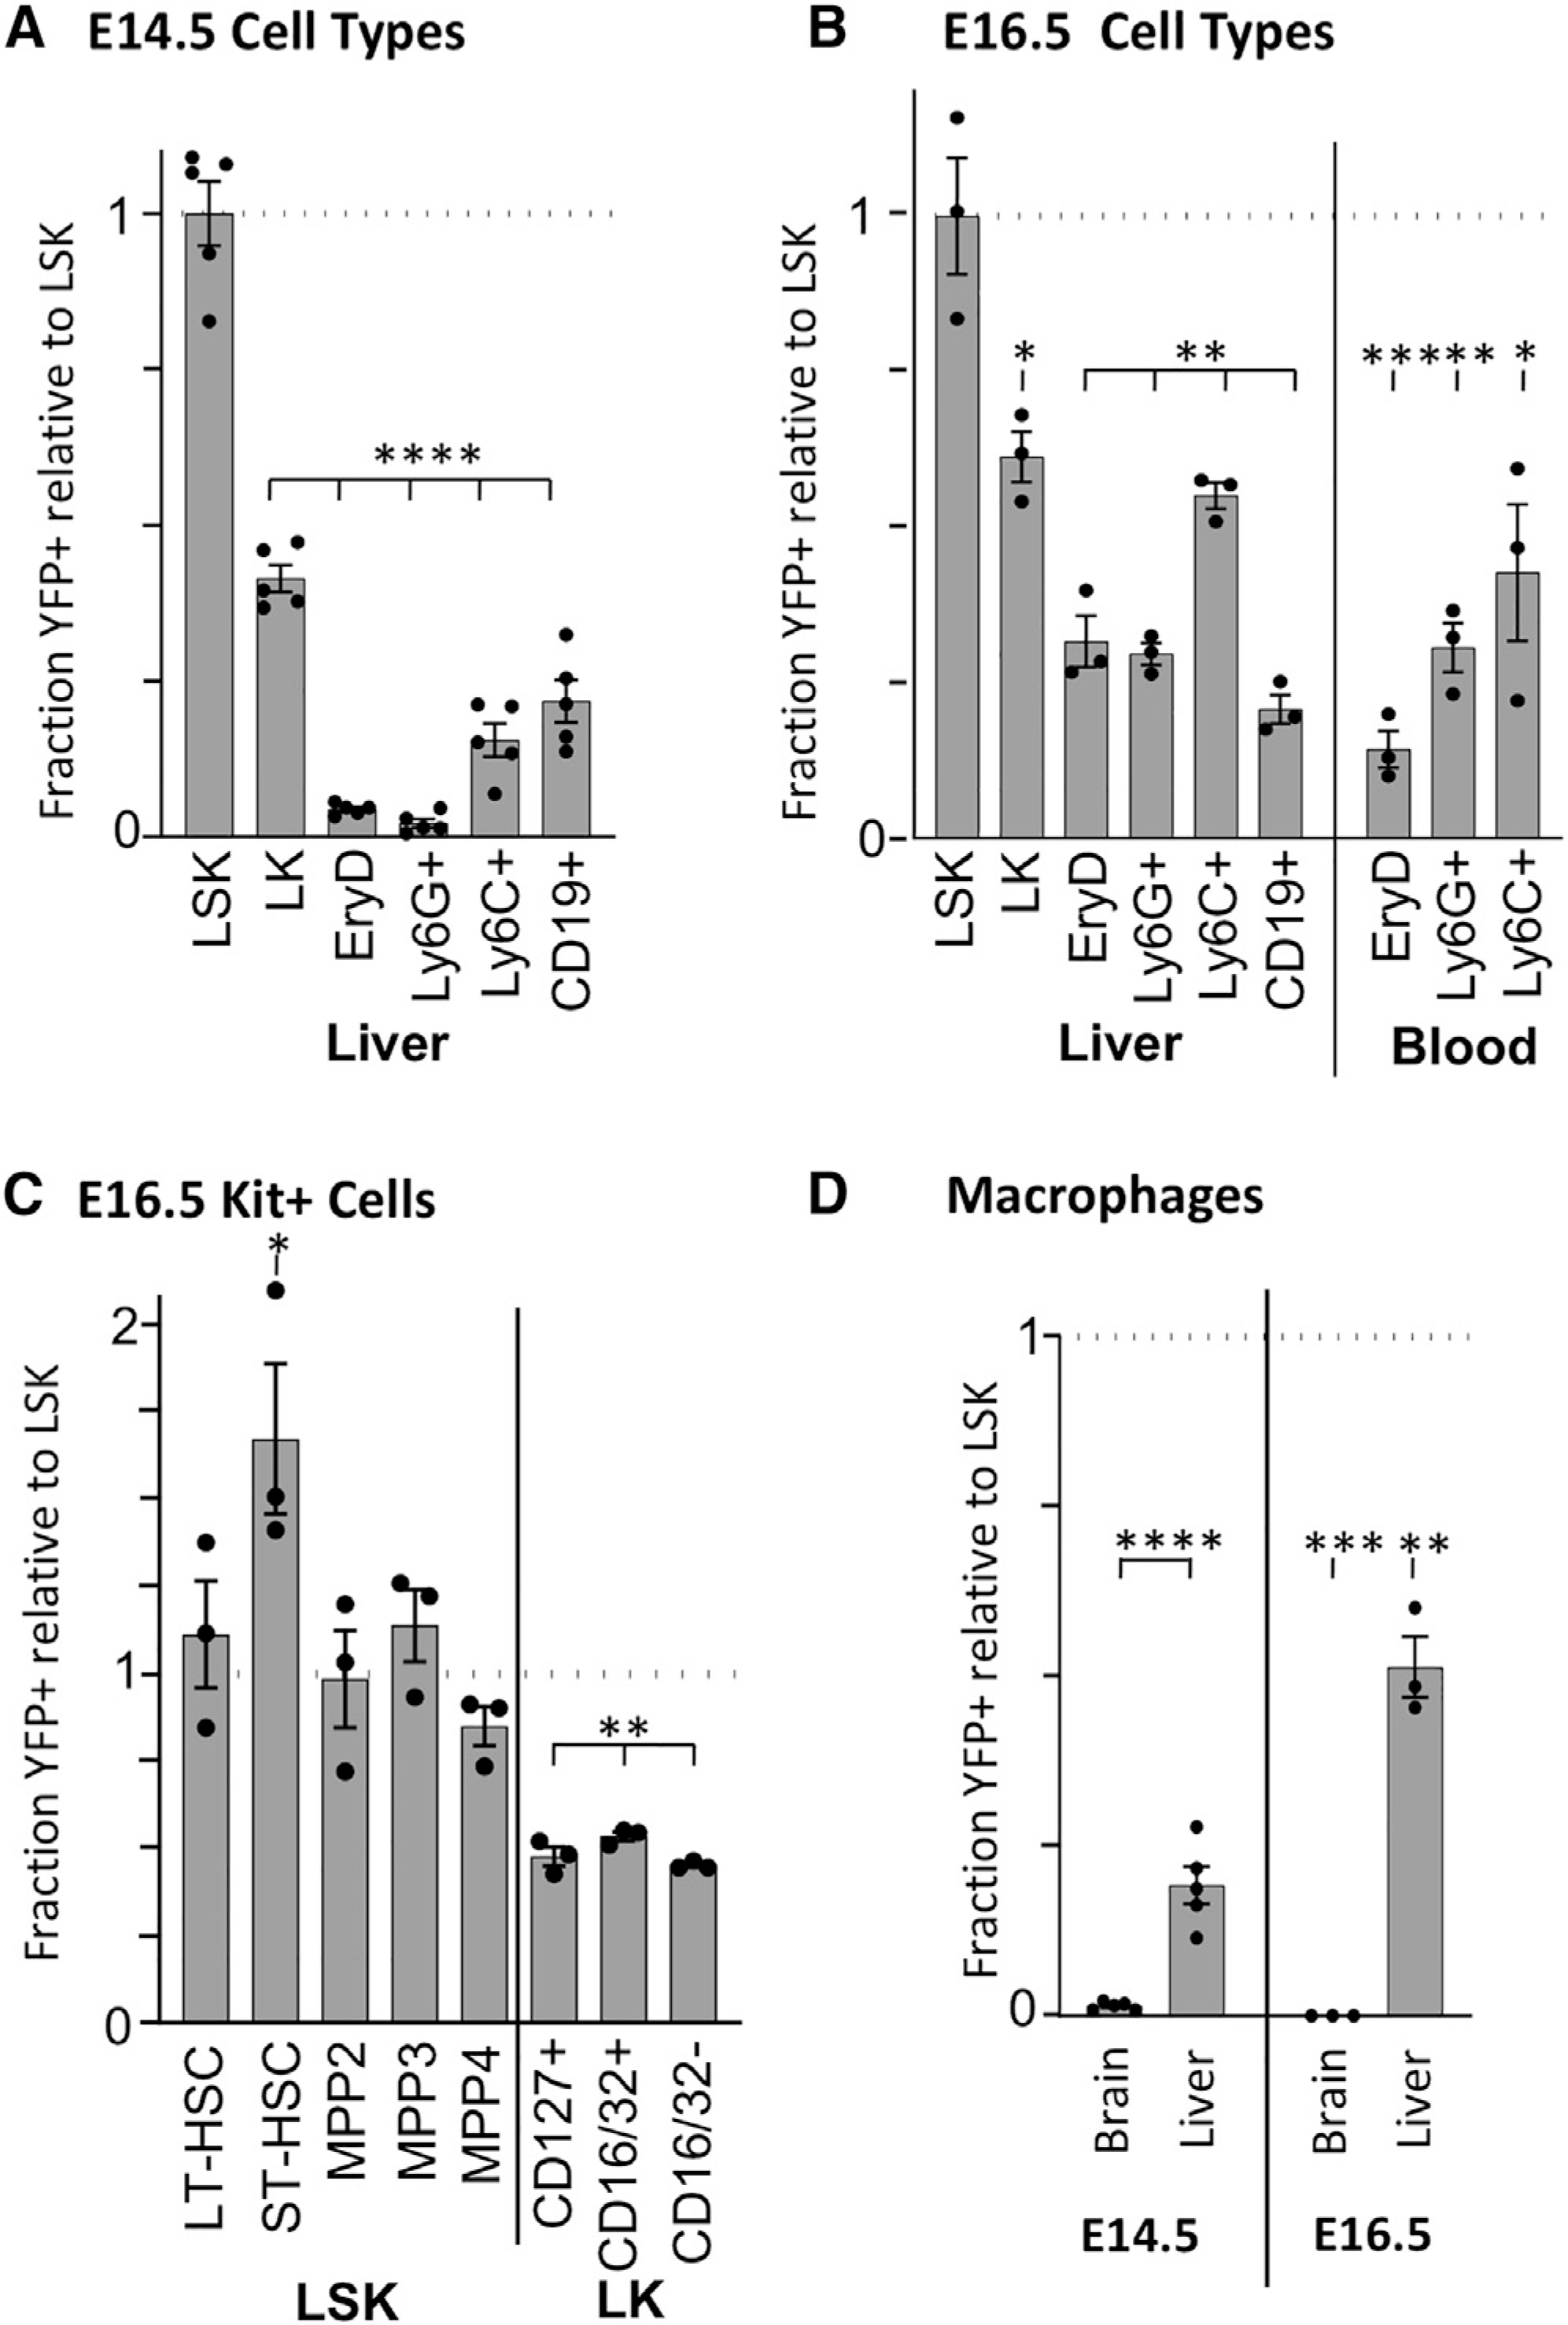
Figure 3. Mds1CreERT2Rosa26LSL-YFP/E9.5 TAM labeling demonstrates increasing presence of HSC-dependent hematopoiesis through E16.5.

(A) Flow cytometric analysis of E14.5 liver cells. Levels of YFP positivity were normalized to the level found in LSK (Lin-Kit+Sca1+, average 23.3% YFP+) to control for excision rates. Averages ± SEM of 5 individual embryos are plotted for LK (Lin-Kit+Sca1−), erythroid (Ter119+FSChi), granulocyte (Ly6G+), monocyte (Ly6C+), and B (CD19+) cells. See Figures S3A and S3B for gating strategy.
(B) Flow cytometric analysis of circulating blood cells and liver cells at E16.5. Averages ± SEM of 3 individuals are plotted. Gating is as in (A) with the addition of circulating definitive erythroid (EryD, Ter119+) cells gated as in Figure S3C. Levels of YFP positivity were normalized to the level found in LSK average 8.1% YFP+) to control for excision rates.
(C) Flow cytometric analysis of E16.5 progenitors in the liver. LSK was further refined into LT-HSC, ST-HSC, MPP2, MPP3, and MPP4 based on Flt3, CD150, and CD48 positivity (see Figures S3A and S3D). LK were further refined into lymphoid (CD127+), myeloid (CD16/32+), and erythroid/megakaryocyte (CD16/32−) progenitors. Values normalized to YFP levels in LSK (B). Averages ± SEM, n = 3.
(D) Analysis by flow cytometry of YFP+ F4/80+ macrophages from E14.5 and E16.5 brain and liver normalized to YFP positivity of LSK (panels A and B). Details of gating are found in Figure S3E. Average ± SEM, n = 3. Unpaired two tail Student’s t test was performed comparing YFP labeling in cell populations to LSK. *p < 0.05; **p < 0.01; ***p < 0.001; ****p < 0.0001.
