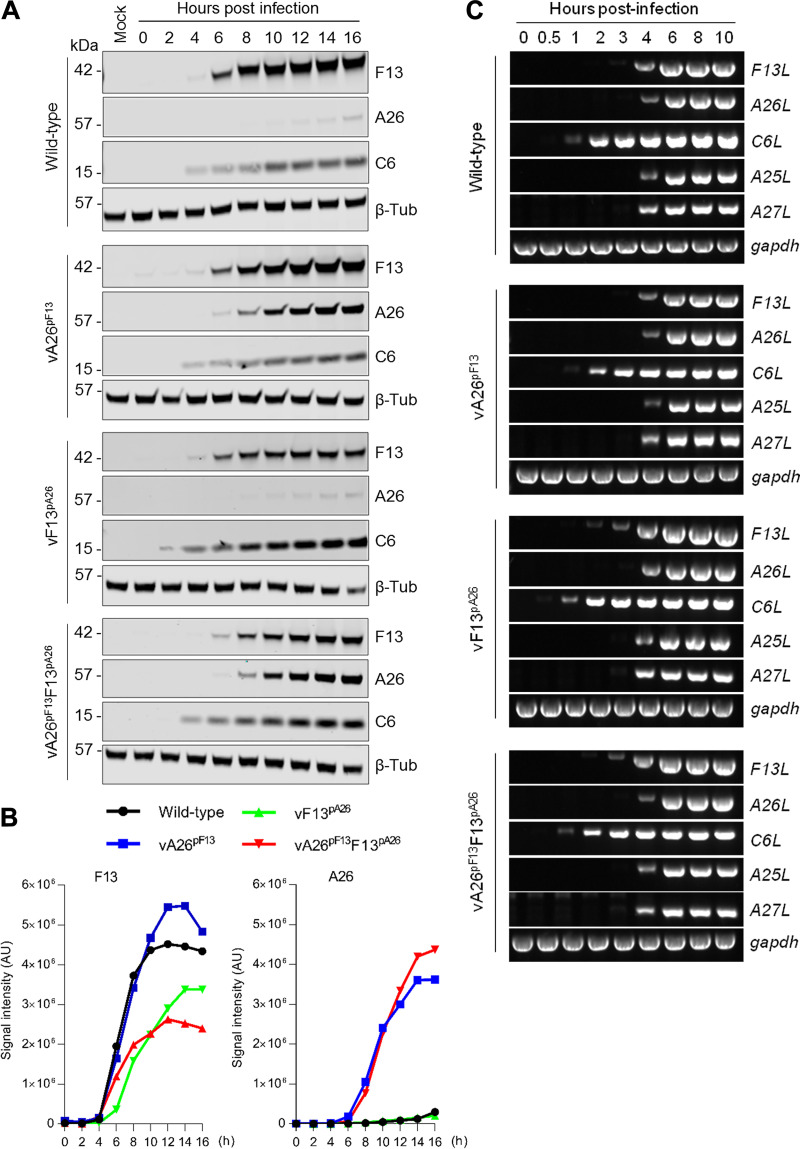
FIG 2.
Viruses expressing A26 under the control of the F13 natural promoter expressed A26 much earlier and at similar kinetics to F13. (A) Cells were infected with 5 PFU/cell of the indicated viruses. At the indicated hour postinfection, cells were lysed and extracts analyzed by quantitative infrared immunoblotting for the expression of A26 and F13 as well as the control viral protein C6 and β-tubulin (β-Tub). (B) Quantitative analysis of A26 and F13 expression over time. Data from (A). Signal intensity (arbitrary units [AU]) recorded for A26 and F13 in each of the indicated virus kinetics was normalized to C6 and plotted over time. Expression of F13 was slightly delayed in vF13pA26 viruses, whereas expression of A26 was advanced in vA26pF13 viruses. (C) RT-PCR for the indicated viral genes and GAPDH was performed on cDNA from cells infected with 2 PFU/cell of the indicated viruses for the indicated length of time. Amplicons were visualized on agarose gels using SYBR-Safe stain. In all cases, one out of two experiments with similar results is shown.

