FIG 3.
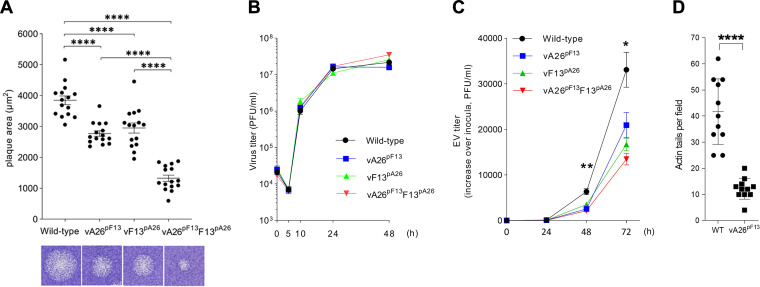
Advanced expression of A26 reduces plaque size, EV formation, and actin tail projections. (A) Analysis of viral spread by plaque assay. Cells were infected with the indicated viruses and incubated in semisolid overlay for 72 h. The area of viral plaques (n = 15) was measured and compared by Student’s t test. A representative plaque is shown underneath the graph. Significant differences in viral spread were observed in all promoter-swapped viruses compared to the wild-type virus (****, P < 0.0001). (B) One-step viral growth curves. Cells were infected with 5 PFU/cell of the indicated viruses in triplicate, and progeny virus was titrated at the indicated hours postinfection and plotted as mean and standard deviation (SD). No significant differences in growth were observed between the viruses. (C) Multistep growth curves. Cells were infected with 0.001 PFU/cell of the indicated viruses in triplicate, and EV in the medium was titrated at the indicated hours postinfection and plotted as mean and SD (fold increase over time). A significant difference was observed between vA26pF13 and wild-type virus using a Student’s t test (*, P < 0.05; **, P < 0.005). (D) The number of actin tails observed during wild-type (WT) and vA26pF13 infection was recorded and compared using Student’s t test (****, P < 0.0001). Advanced expression of A26 in vA26pF13 reduced the number of actin tails, a process known to be mediated by EV.

