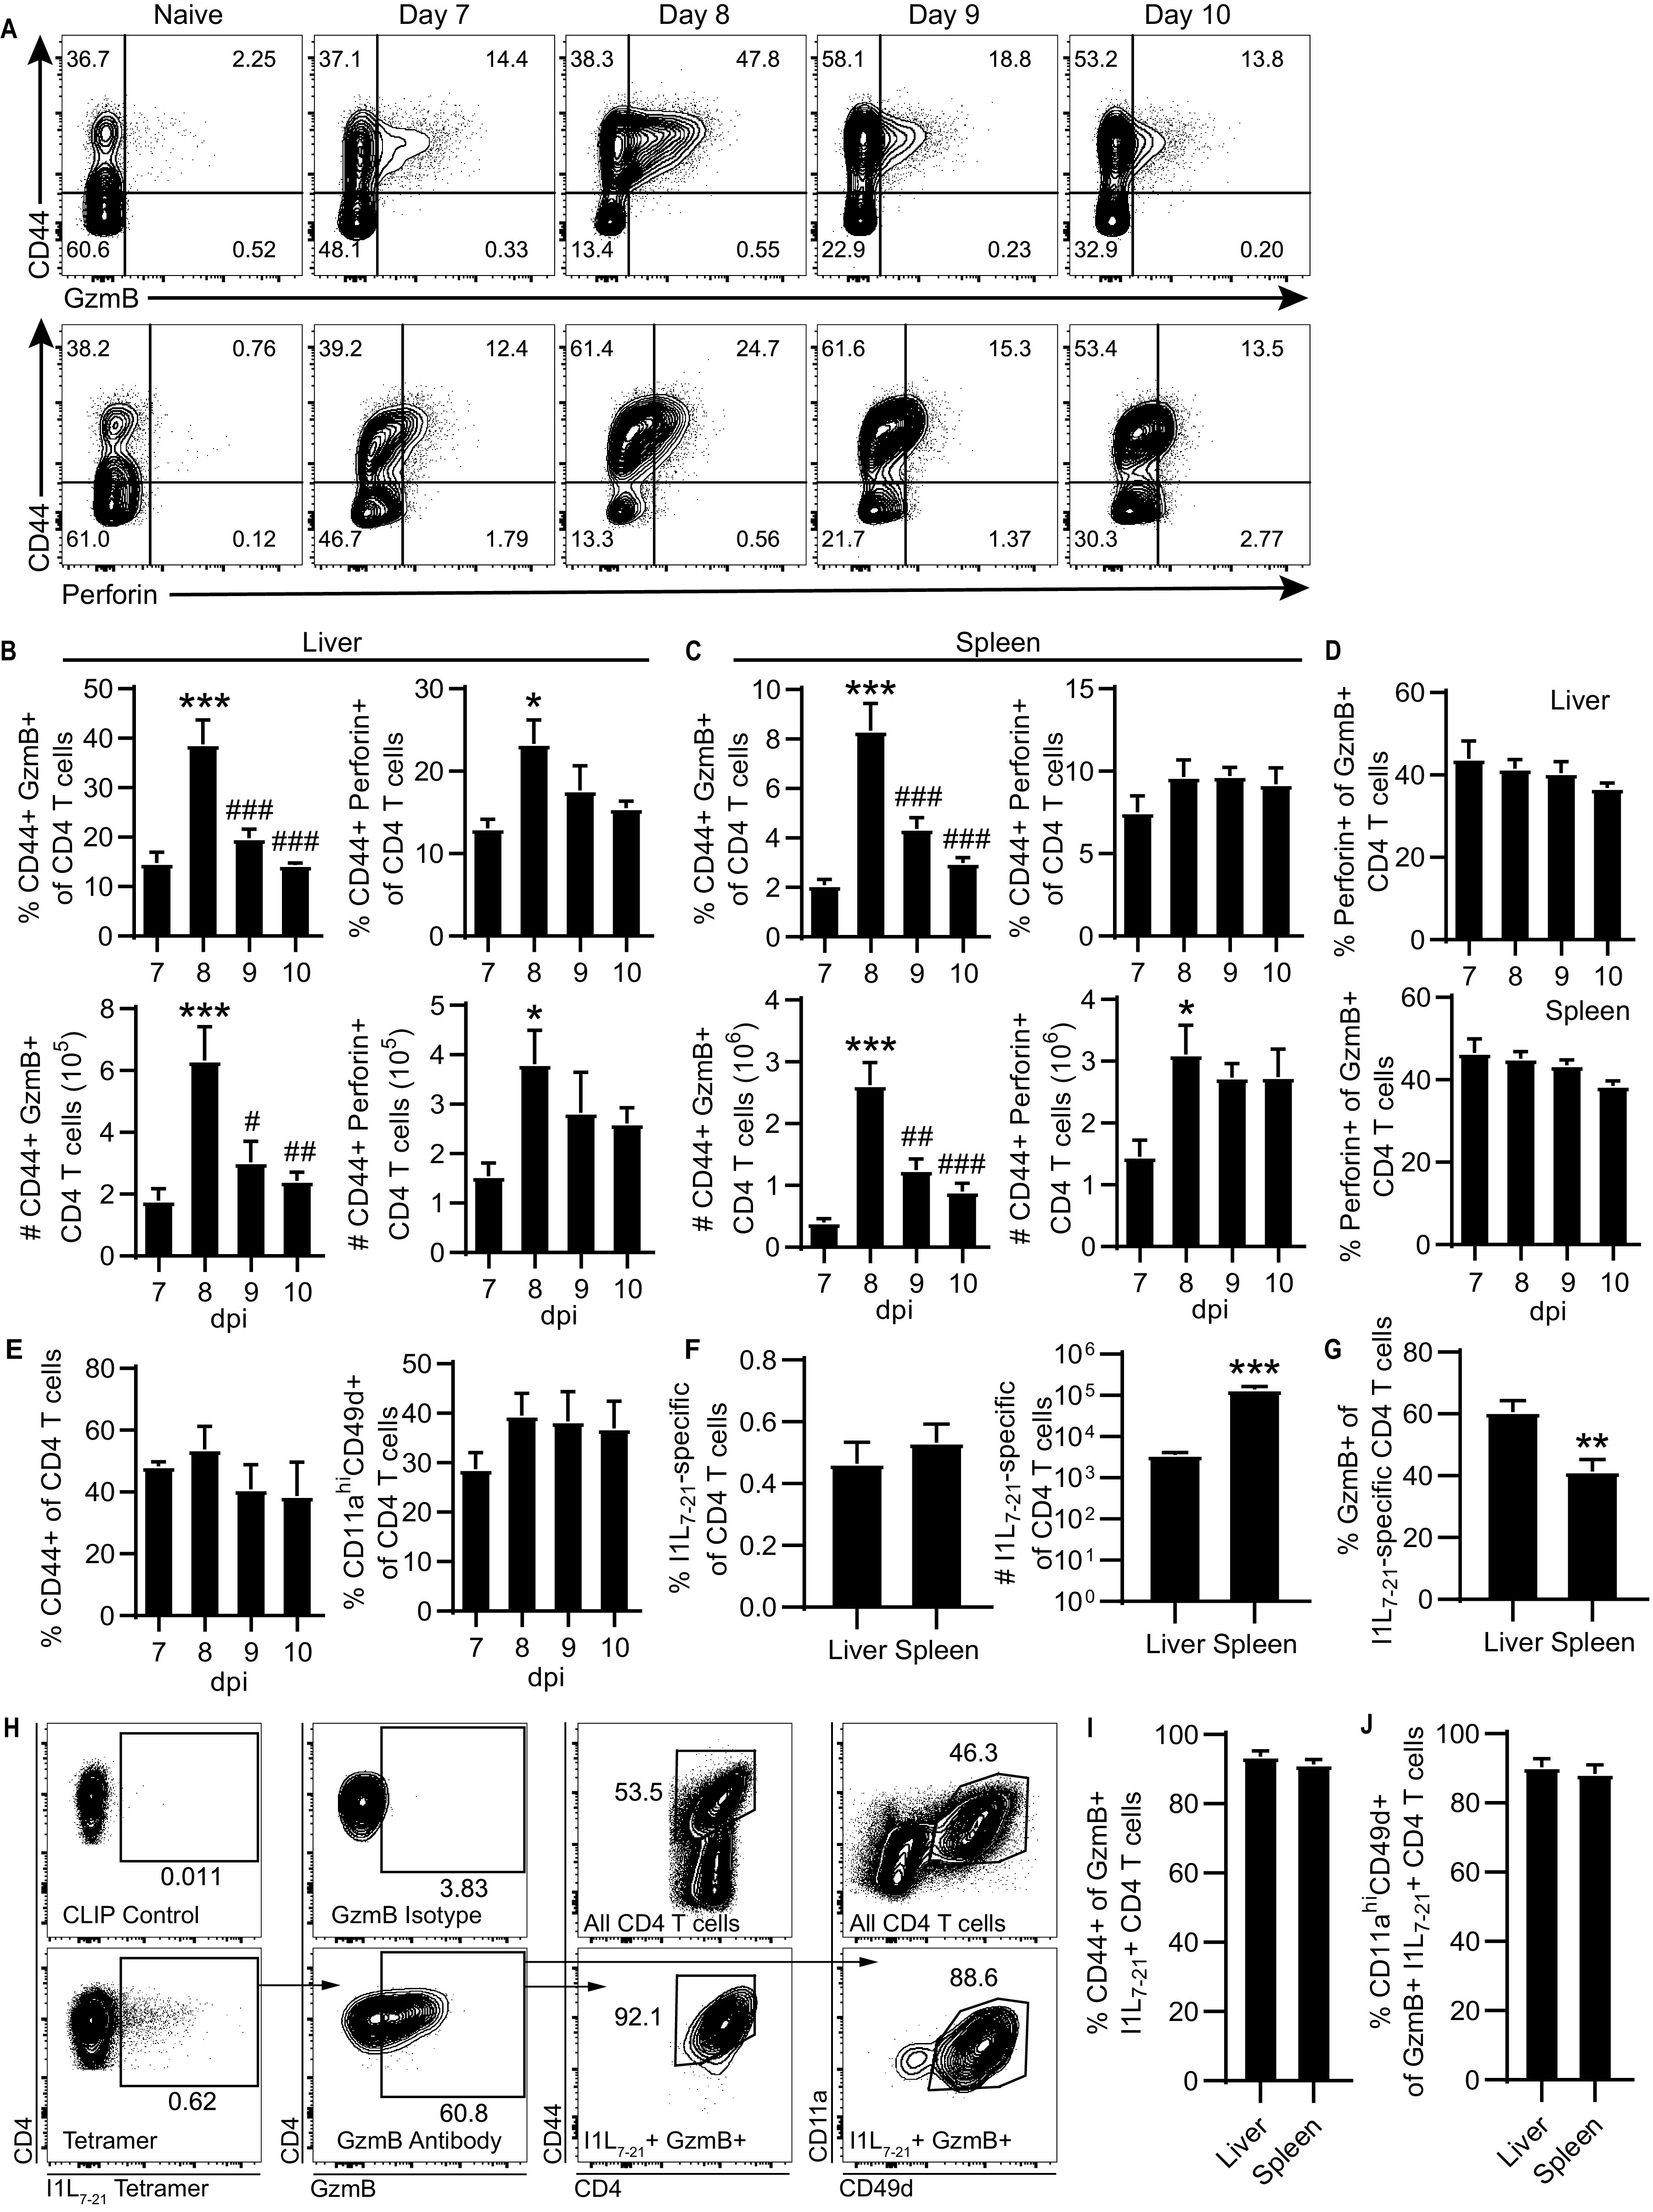
FIG 1.

Transient CD4-CTL response induced following ECTV infection. B6 mice were infected with 3,000 PFU of ECTV in the footpad. (A) Representative flow plots of CD44 by GzmB (top panels) or perforin (bottom panels) gated on CD4 T cells from the liver at the indicated time points after infection. The percentages (top panels) and total numbers (bottom panels) of GzmB+ and perforin+ CD4 T cells in the liver (B) or spleen (C) are shown for the indicated dpi. (D) Frequency perforin+ cells of GzmB+ CD4 T cells. (E) Percentage activated CD44+ or CD11ahi CD49d+ of CD4 T cells. (F) Frequency and total number of I1L7-21-specific CD4 T cells in the liver and spleen at 8 dpi. (G) Percent GzmB+ of I1L7-21-specific CD4 T cells at 8 dpi in the liver and spleen. (H) Staining of I1L7-21 tetramer, GzmB, CD44, CD11a, and CD49d at 8 dpi in the liver. Flow plots are concatenated from four mice. The top panels show control stains for determination of gate placement, as indicated by text. (I and J) CD44+ (I) or CD11ahi CD49d+ (J) frequency of GzmB+I1L7-21-specific CD4 T cells at 8 dpi in the liver and spleen. Asterisks (*) denote statistical differences compared to 7 dpi, whereas number symbols (#) denote statistical differences compared to 8 dpi. Compiled data are displayed as means ± the standard errors of the mean (SEM) representing two independent experiments (A to E, n = 6; F to J, n = 9).
