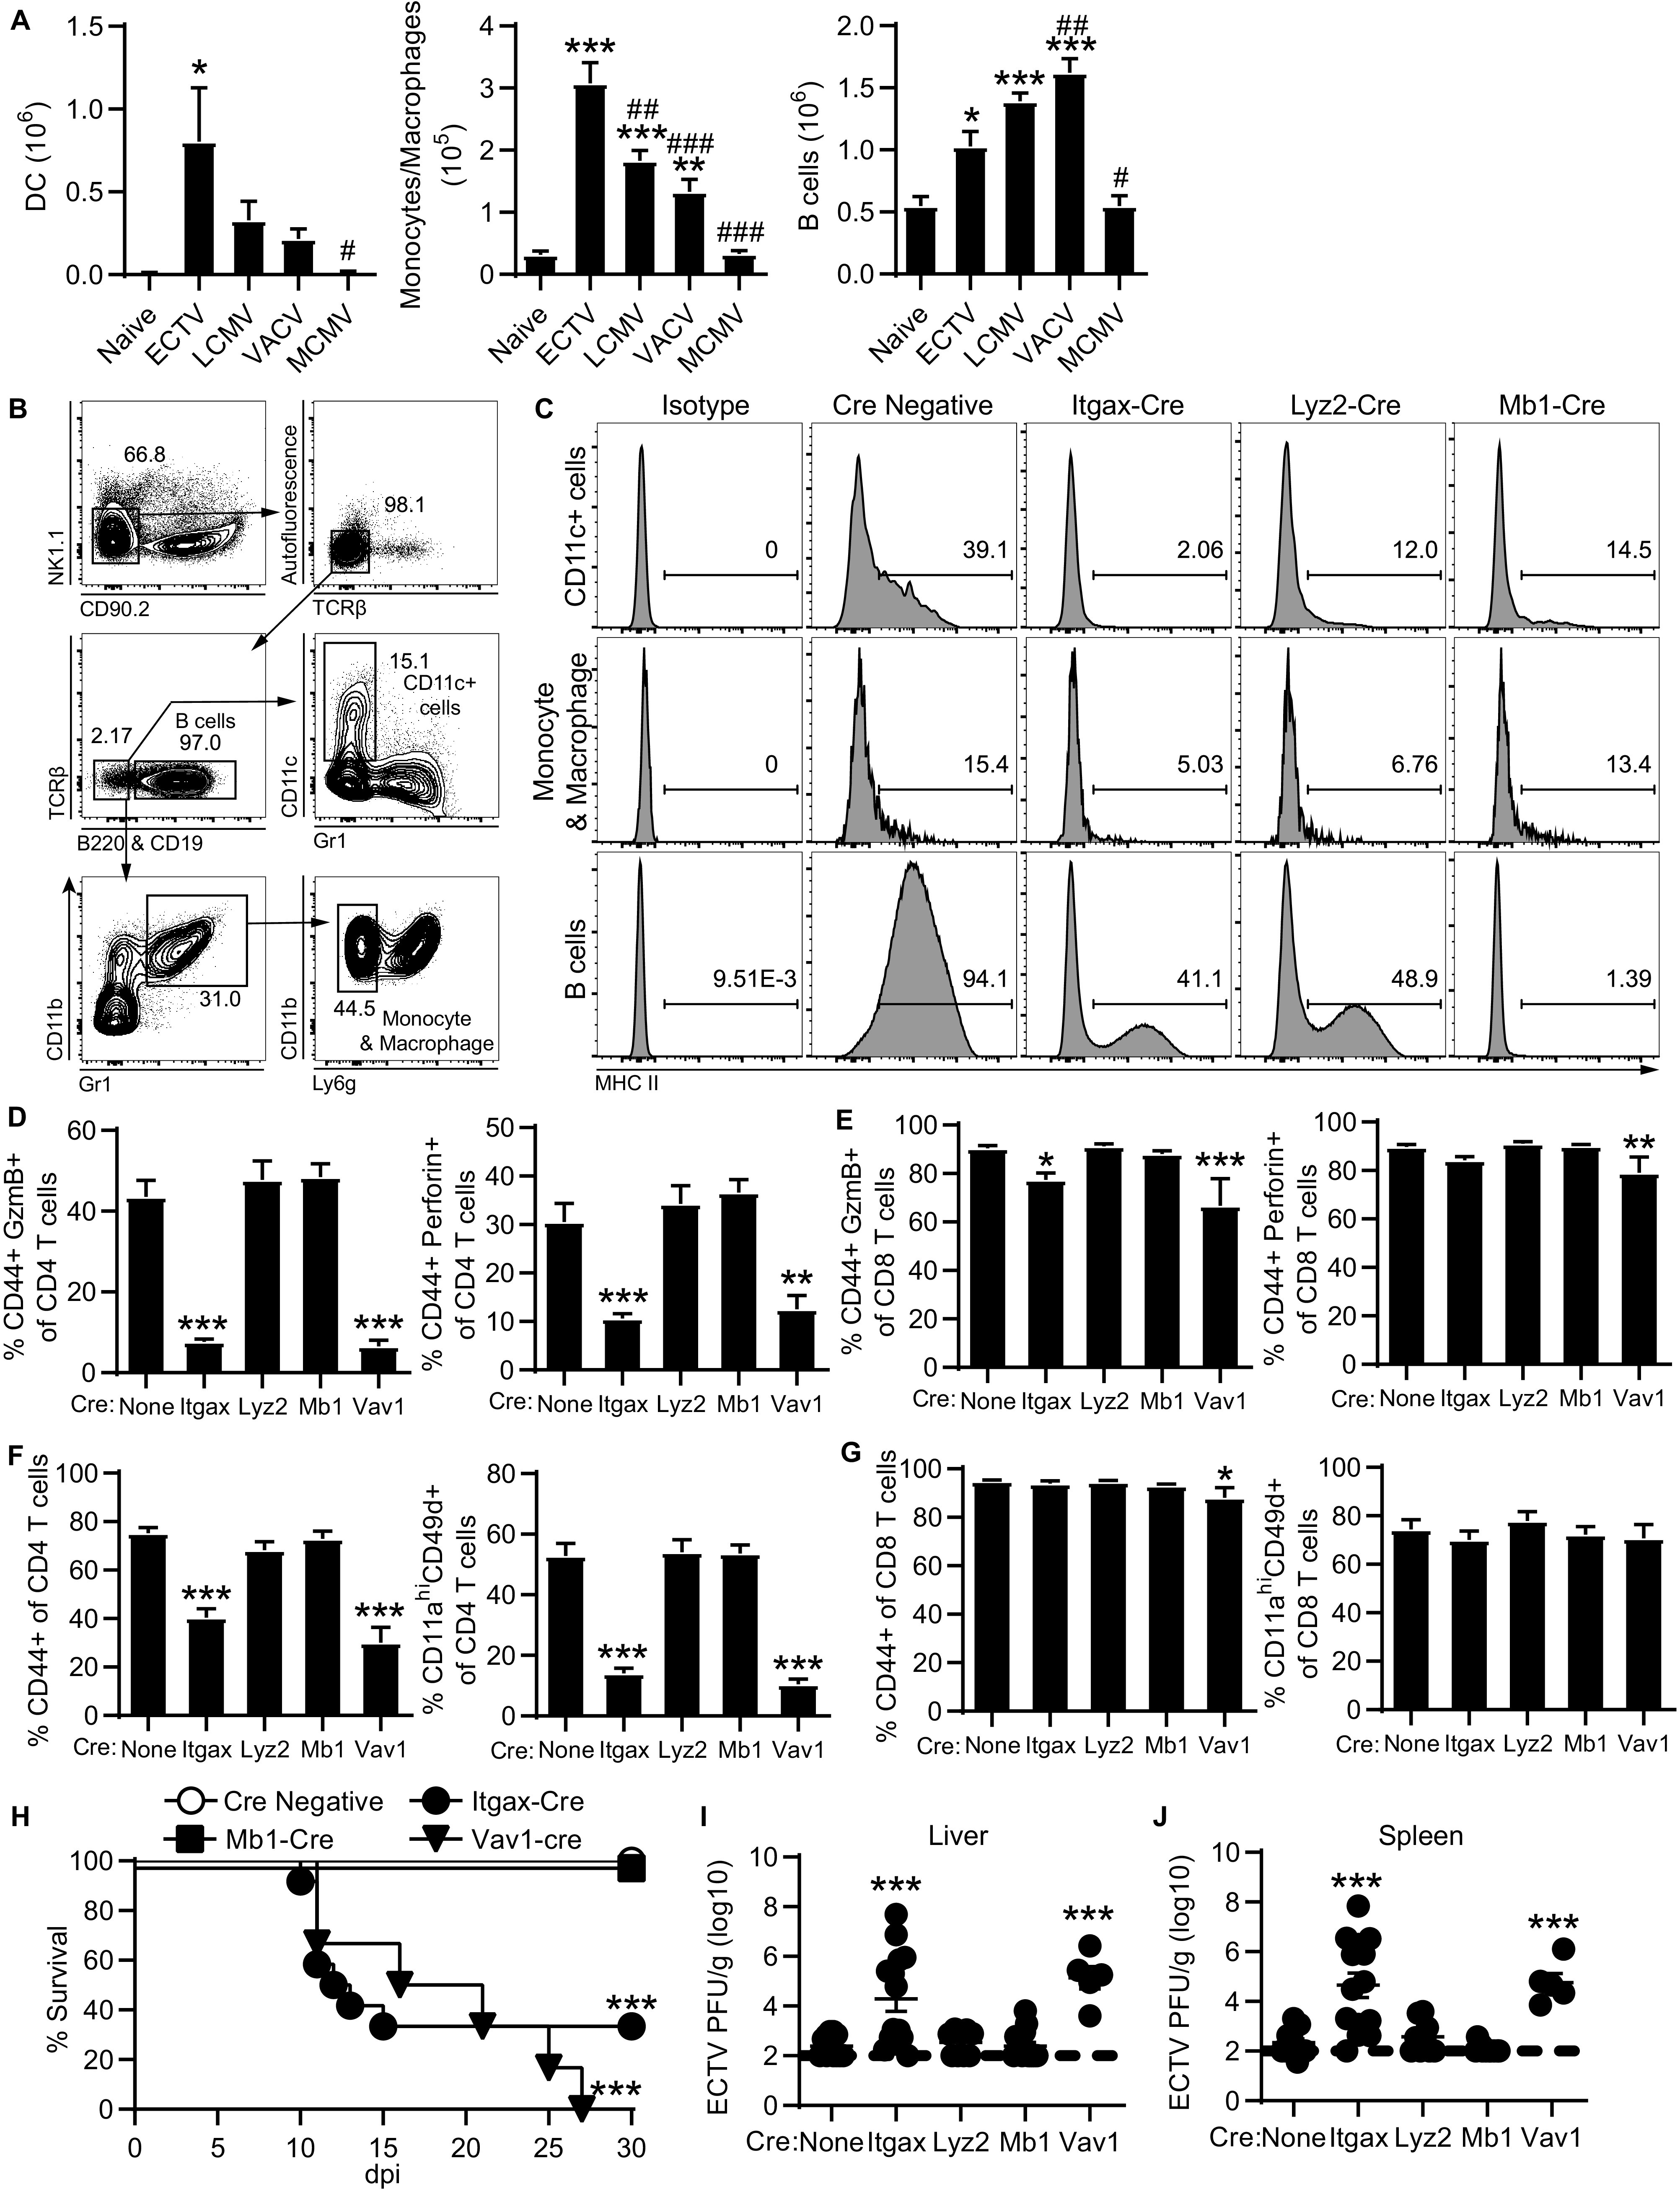
FIG 5.

MHC-II on CD11c+ cells induces the overall CD4 T cell response and CD4-CTLs. (A) Total number of DCs, monocytes/macrophages, and B cells in the liver from mice infected with ECTV, LCMV, VACV, or MCMV. Asterisks (*) denote statistical differences compared to naive group, while number symbols (#) are comparisons to the ECTV-infected group. The data are displayed as means ± the SEM compiled from two independent experiments (n = 6). (B) Concatenated flow plot representing gating for antigen-presenting cell subsets from spleens of 4 naive MHC-IIfl/fl mice. MHC-IIfl/fl mice were bred with indicated cre-expressing strains. (C) Histograms of MHC-II expression on CD11c+ cells, monocytes and macrophages, or B cells in spleens from crossed naive mice. The data are concatenated from four mice in each group. (D to J) The crossed cre-lox mice were challenged with ECTV and analyzed at 8 dpi. Groups are compared to the MHC-IIfl/fl mice with no cre expression (none) for statistical analysis. (D and E) GzmB+ or perforin+ frequency of CD4 T cells (D) and CD8 T cells (E) in the liver. (F and G) Frequency of activated CD44+ or CD11ahi CD49d+ of CD4 T cells (F) and CD8 T cells (G). (H) Survival curve tracking mice for 30 days following infection (cre negative, n = 38; Itgax-cre, n = 12; Mb1-cre, n = 10; Vav1-cre, n = 6). (I and J) Virus titers in the livers (I) and spleens (J) of infected mice. Asterisks (*) denote statistical differences compared to naive mice, while number symbols (#) denote differences compared to the ECTV-infected group. Compiled data are displayed as means ± the SEM from two to three independent experiments (None, n = 12; Itgax, n = 14; Lyz2, n = 9; Mb1, n = 14; Vav1, n = 5).
