
FIG 6.
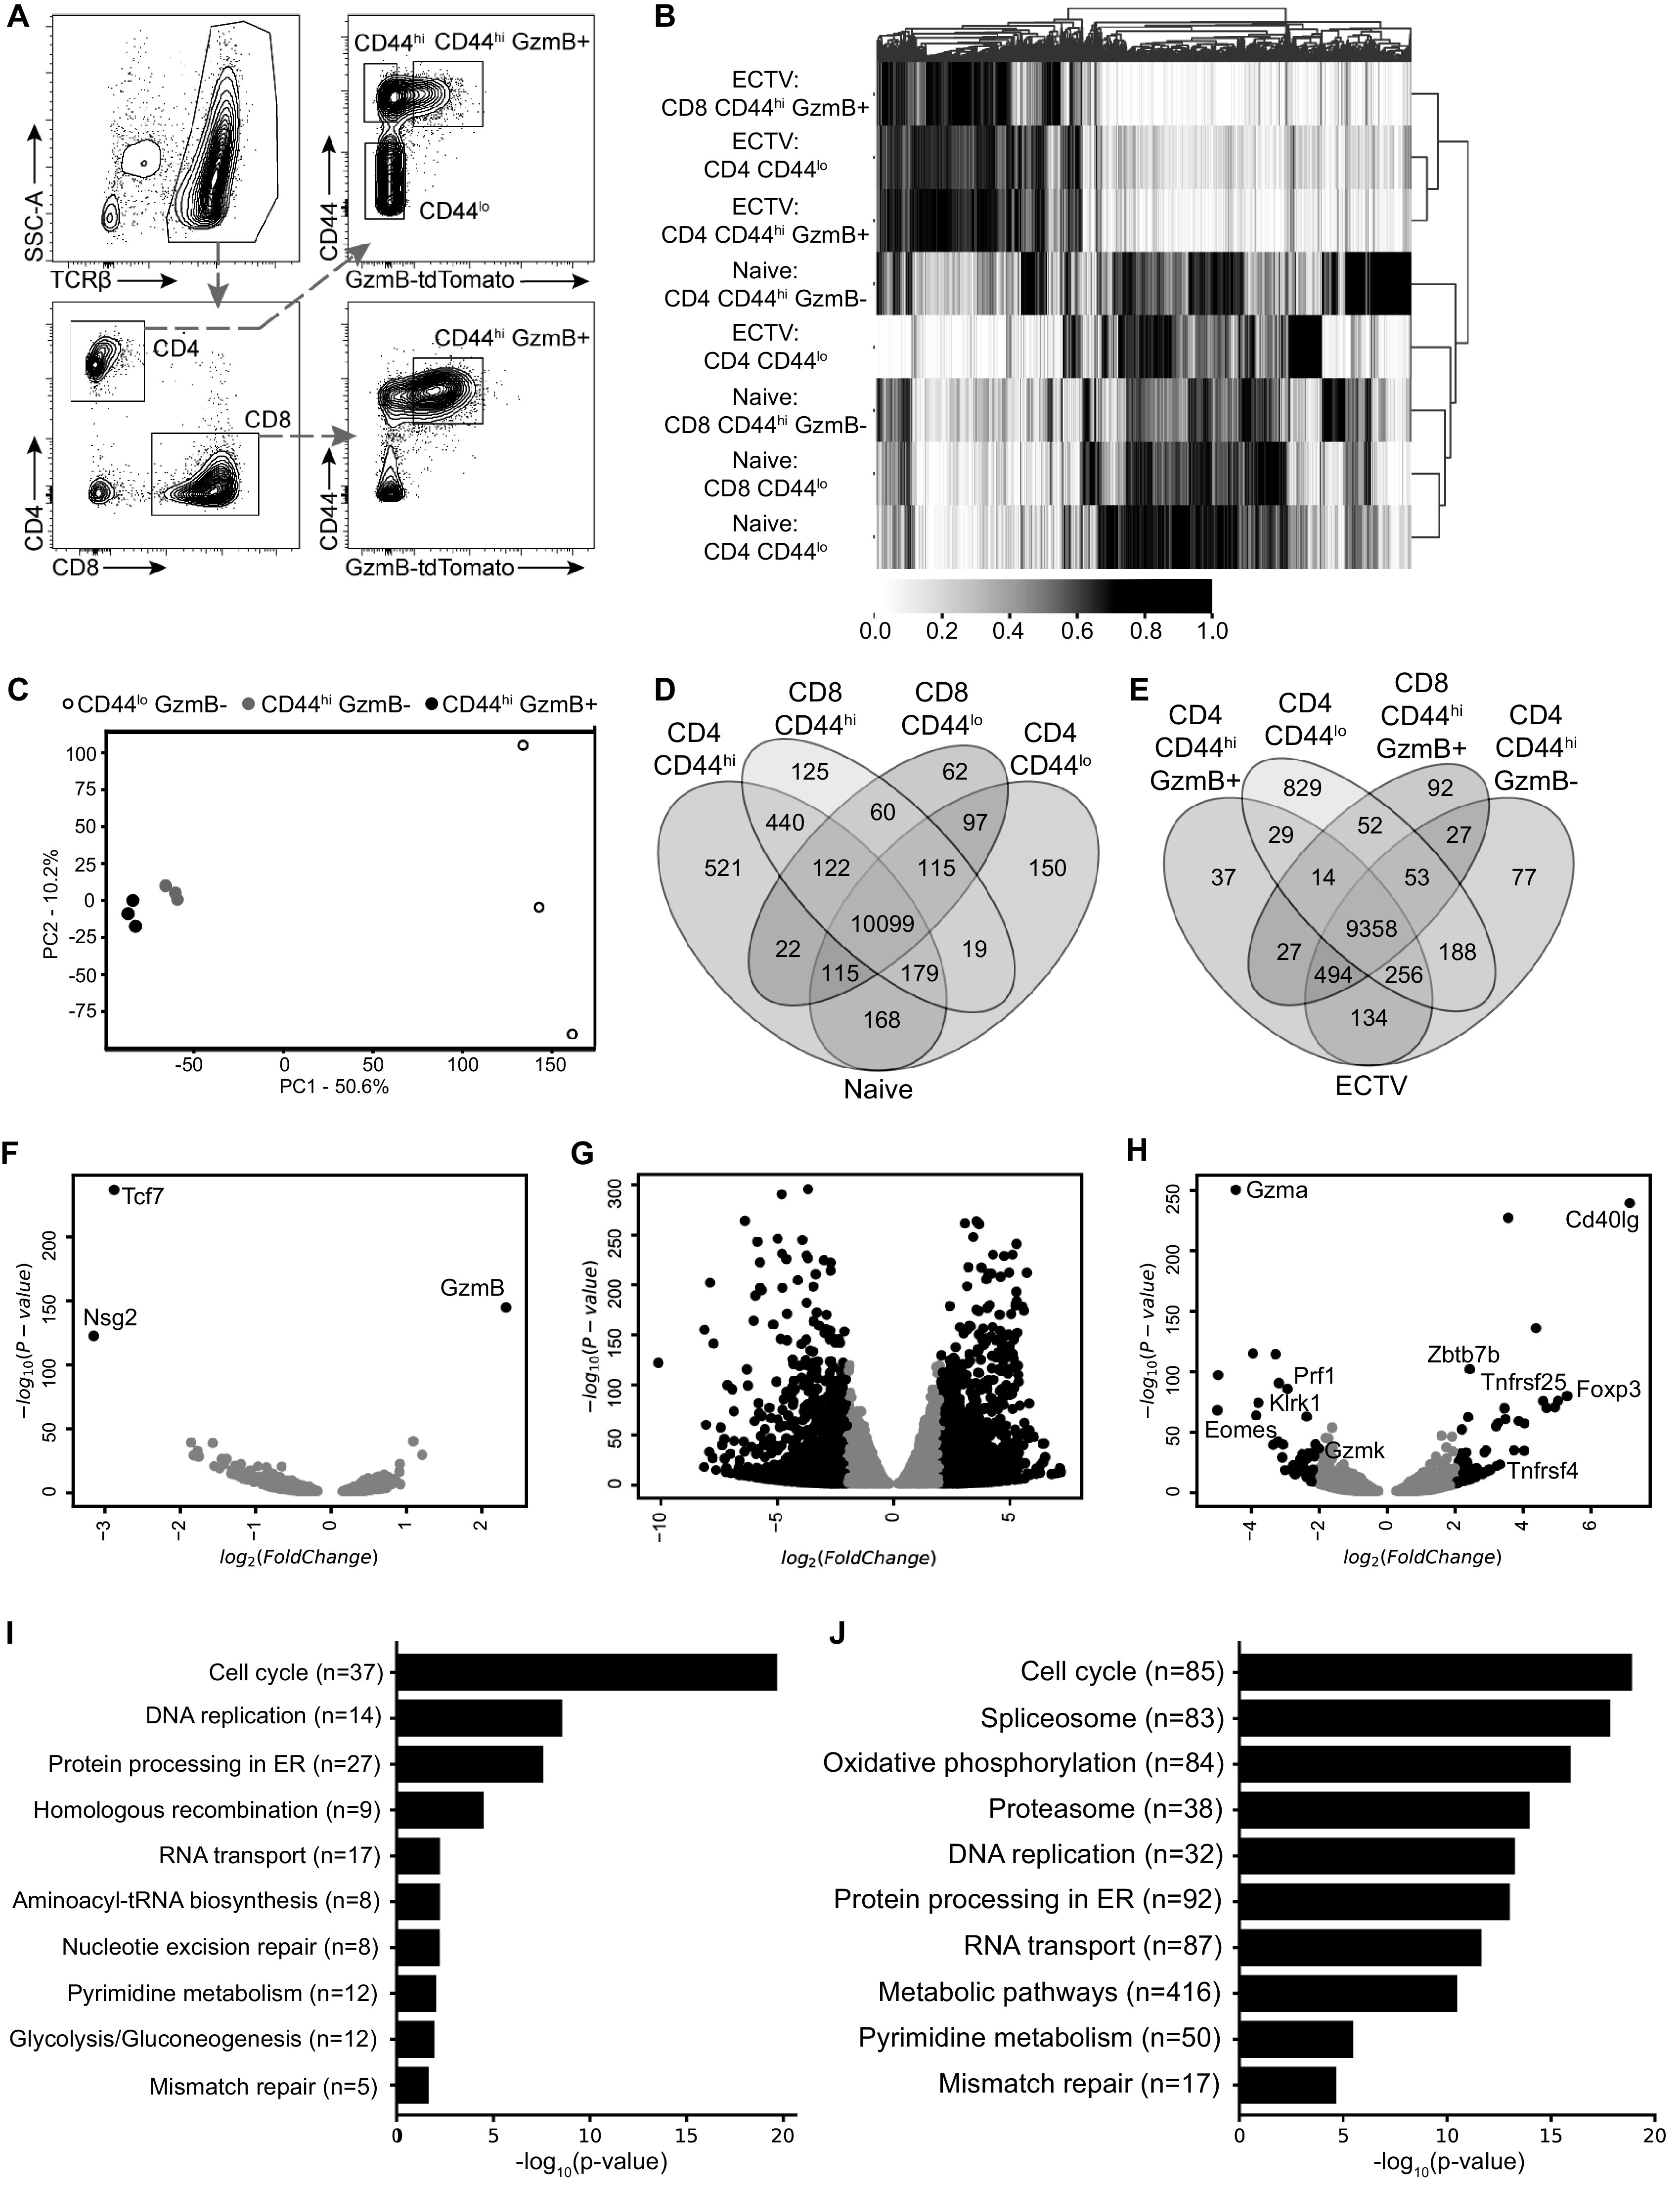
Activated noncytotoxic and cytotoxic CD4 T cells have similar transcriptional profiles. GzmB-tdTomato reporter mice were infected with ECTV and 10 livers were processed into a single cell suspension, followed by magnetic purification for T cells at 7 dpi. RNA samples for each cell population were collected a total of three times across independent experiments. (A) Representative flow plot illustrating gating strategy used to sort and isolate T cell populations based on CD44 and GzmB-tdTomato expression. (B) Heatmap with cluster analysis with normalized values for sequenced genes from sorted T cell populations. (C) PCA for sorted CD4 T cell populations from infected mice. The percentages indicate the total variance represented by each component. (D and E) Venn diagram analysis of the indicated T cell populations from naive mice (D) or ECTV-infected mice (E). (F to H) Volcano plots of differentially expressed genes comparing CD44hi GzmB+ and CD44hi GzmB– CD4 T cells (F), CD44hi GzmB+ and CD44lo CD4 T cells (G), and CD44hi GzmB+ CD4 T cells and CD44hi GzmB+ CD8 T cells (H). Comparisons were done on samples from infected mice. Genes of interest are shown as black dots using cutoffs of log2(FoldChange) = 2 and an adjusted P value of <0.05. Gray dots represent genes that did not meet cutoff values. (I and J) Analysis showing top 10 enriched pathways using KEGG database ranked by adjusted P value comparing CD44hi GzmB+ and CD44hi GzmB– CD4 T cells (I) and CD44hi GzmB+ and CD44lo CD4 T cells (J).