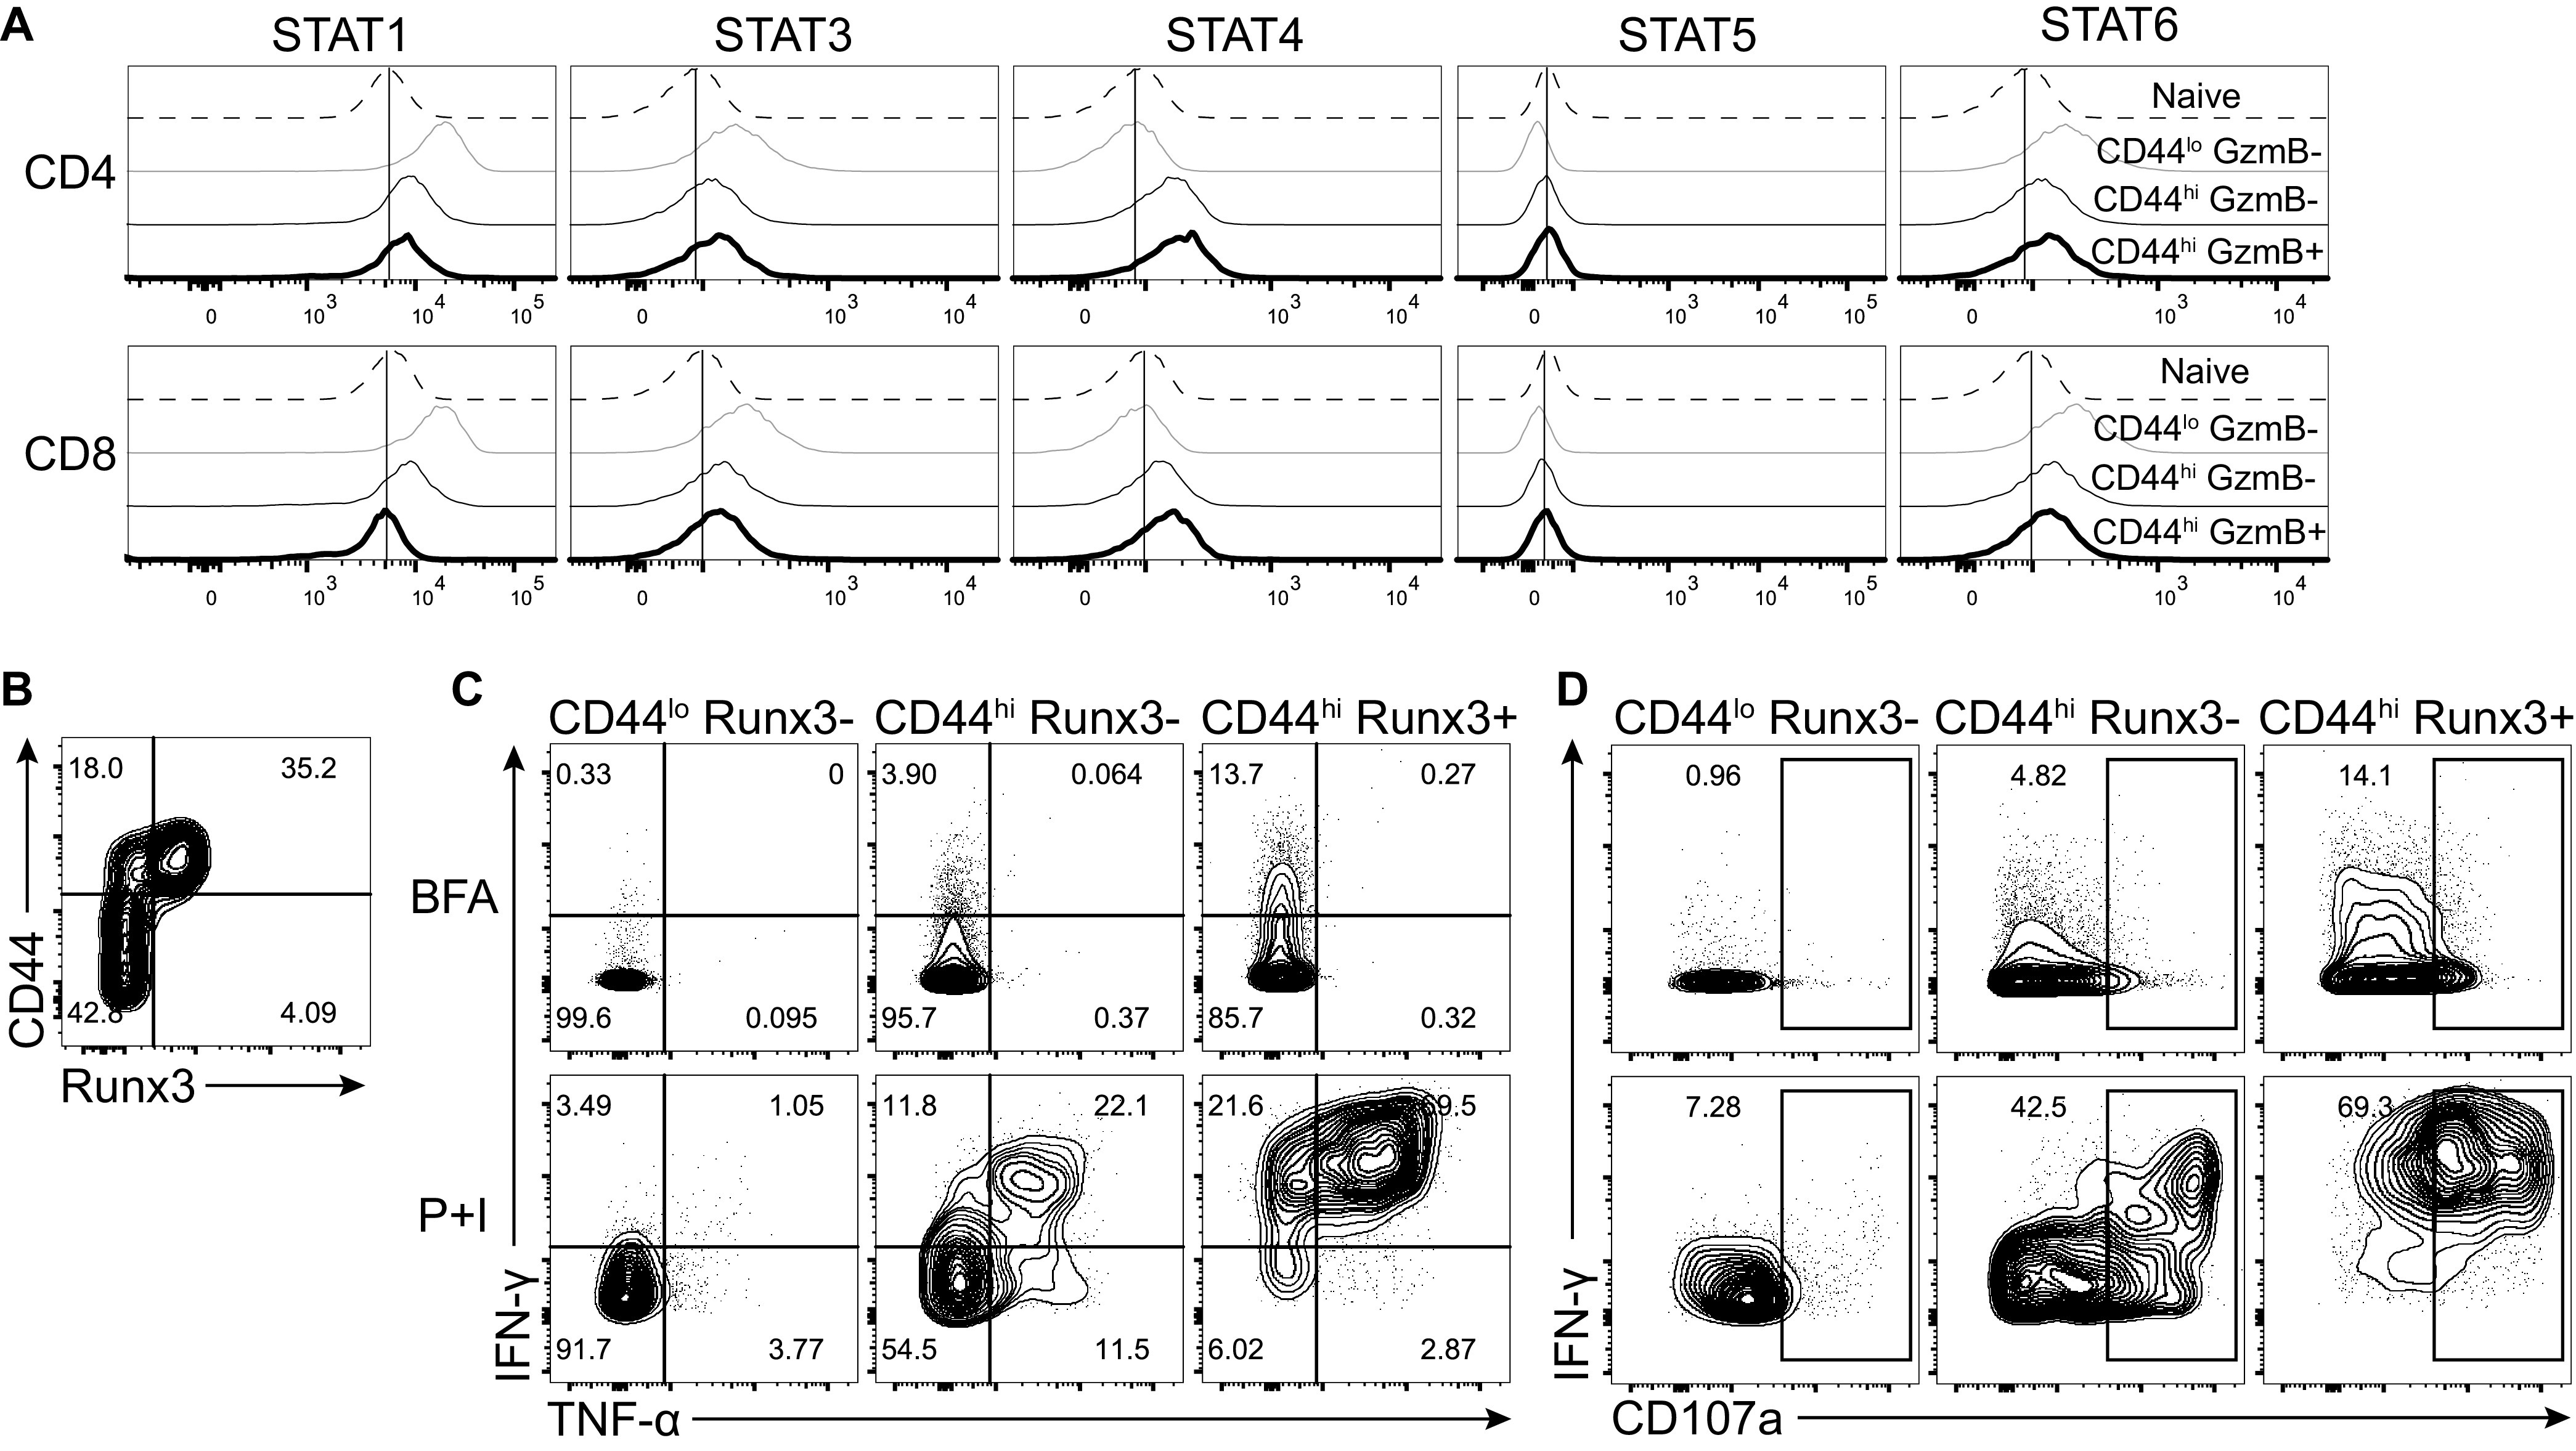
FIG 8.

CD4-CTLs are terminally differentiation Th1 cells. (A) Histograms for staining of phosphorylated STATs on splenic T cell populations. (B to D) Splenocytes were restimulated with PMA and ionomycin (P+I) with brefeldin A (BFA) for 4 h on day 7 after ECTV infection (lower panels). As a control, splenocytes were only incubated with BFA (top panels). (B) Flow plot of CD44 by Runx3 expression used to gate CD4 subsets in panels C and D. (C and D) Representative flow plots of IFN-γ by TNF-α (C) or IFN-γ by CD107a (D) after gating on the indicated CD4 T cell populations. All flow plots are representative of the indicated group from two independent experiments.
