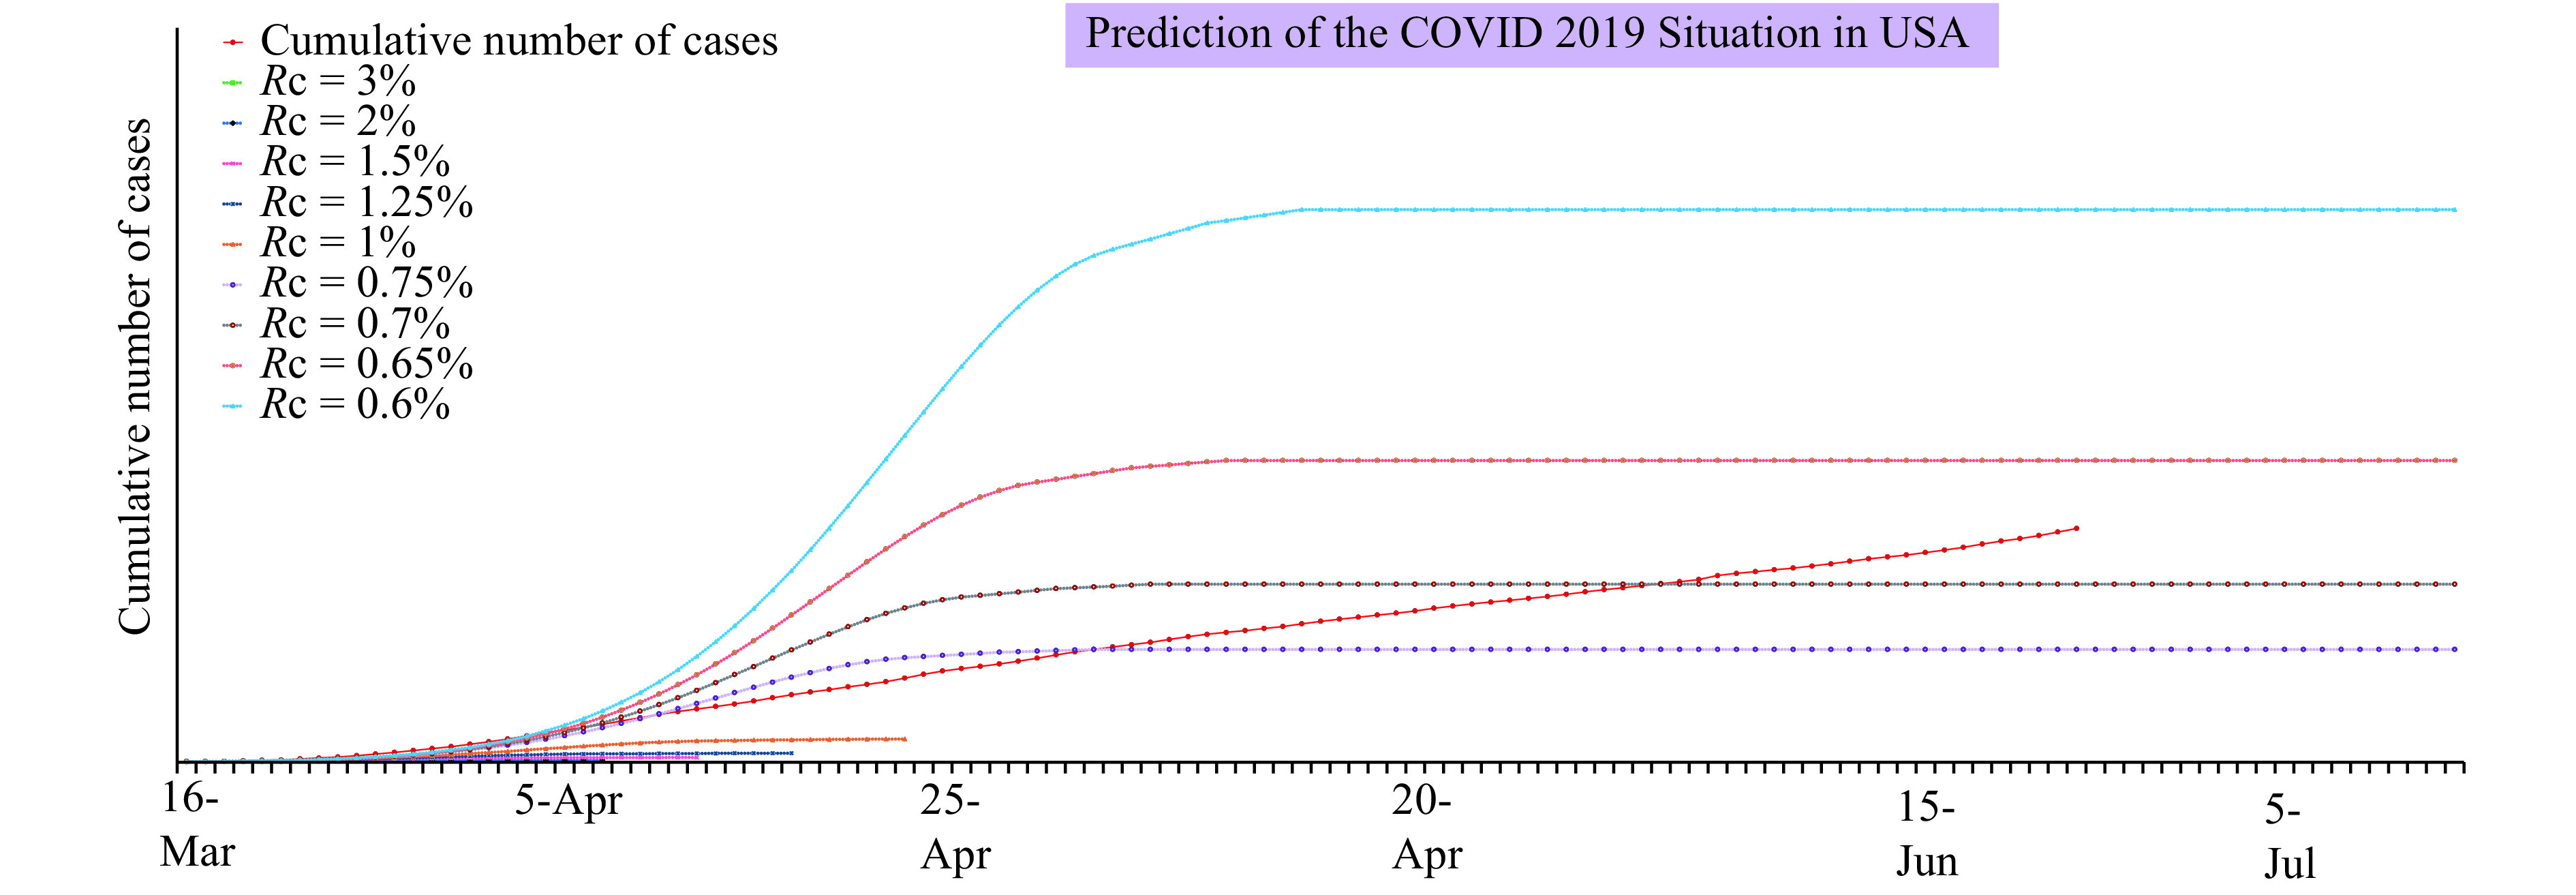
Figure 2.

Professor Jian Lu’s modeling of COVID-19 progression in the United States. The real progression was indicated by the red curve, and the other curves projected the progression at various reduction coefficients, Rc, of the rate of increase of daily cases. This curve indicated that COVID-19 is still not adequately controlled as the red line has exceeded the projected lines of Rc=0.75% and Rc=0.7%. Professor Jian Lu’s models of other countries and of several states in the USA are available at his homepage: http://personal.cityu.edu.hk/jianlu.
