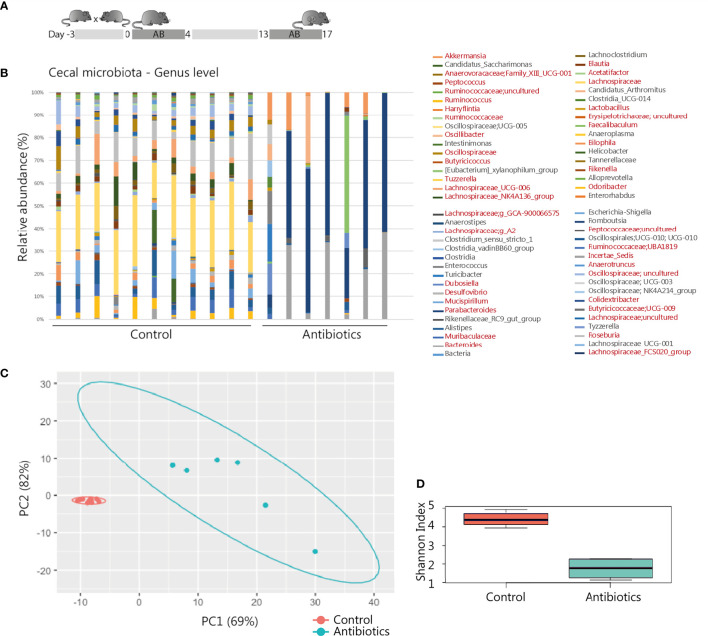
Figure 1.
Antibiotic intervention in pregnant BALB/c mice. (A) Schematic representation of the experimental model. After randomly assigning mated mice to the treatment groups, 11 mice of the control and 8 mice of the treatment group were pregnant and included for further analysis. (B) 16S rRNA composition of the cecal samples per individual animal (1 sample of the antibiotic treatment group excluded due to read count <500). In the legend, genera shown in red were significantly affected by the treatment (see also Supplementary Table T1). (C) Principal component analysis of 16S rRNA sequencing data on genus level. (D) Shannon Index presenting microbial diversity.

