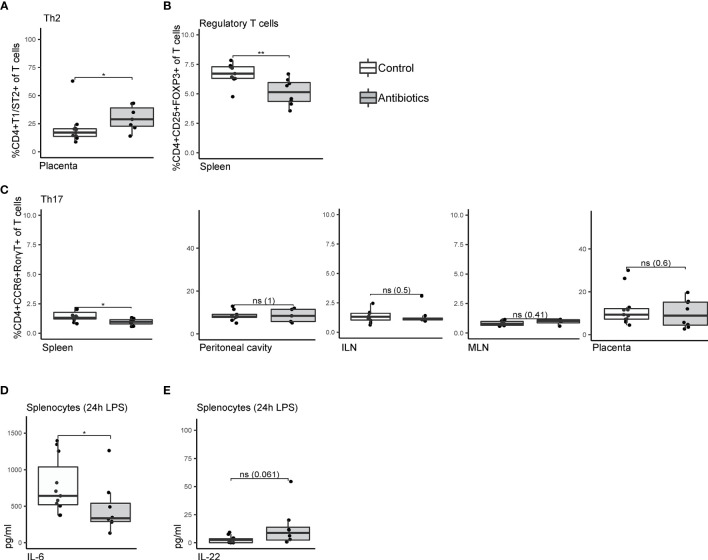
Figure 3.
Univariate analysis comparing T cell subsets of antibiotic-treated and control mice. (A) Frequencies of T helper 2 cells within T cells isolated from placental tissue, staining CD4+T1ST2+. (B) Splenic CD4+CD25+FOXP3+ regulatory T cells as frequency of total T cells. (C) CD4+CCR6+RORT+ T helper 17 cells isolated from spleen, peritoneal cavity lavage fluid, inguinal lymph nodes, mesenteric lymph nodes, and placenta. (D) Concentrations of IL-6 and (E) IL-22 in supernatant of splenocytes after 24h lipopolysaccharide stimulation. Cytokine expression levels were corrected for concentrations measured in unstimulated splenocytes. Data were compared by Mann-Whitney/Wilcoxon tests (non-parametric), *p < 0.05 **p < 0.01. ILN, Inguinal lymph nodes; LPS, lipopolysaccharide; MLN, mesenteric lymph nodes; ns, non-significant.

