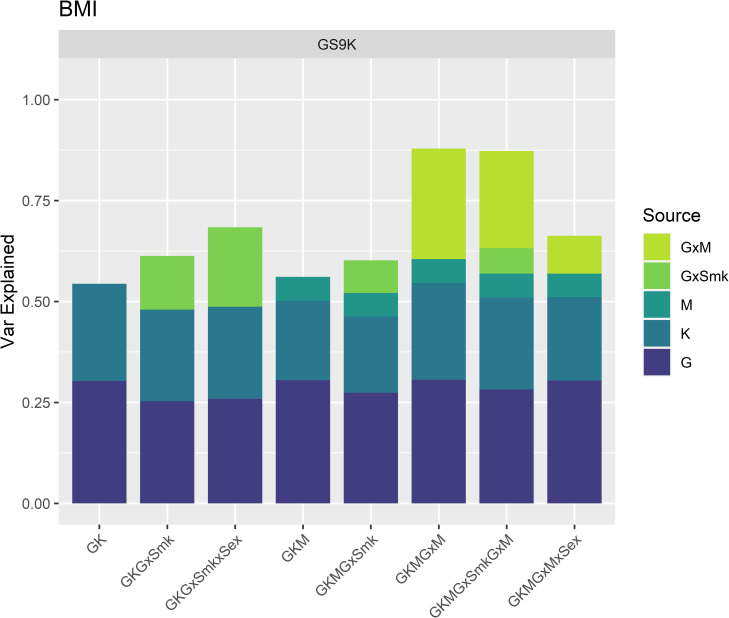
Fig 4. Proportion of BMI variation explained by genetic, environmental and methylation sources in GS9K.
Proportion of BMI variance (y-axis) explained by each of the genetic, environmental and interaction sources in the corresponding models (x-axis). G: Genomic, K: Kinship, GxSmk: Genome-by-Smoking, M: Smoking associated methylation, GxM: Genome-by-Methylation, GxSmkxSex: Genome-by-Smoking-by-Sex, GxMxSex: Genome-by-Methylation-by-Sex.

